LayerZero (ZRO) signals a bottom, opening up expectations for a new bullish phase
LayerZero (ZRO) has made an impressive breakout after the recent market crash, continuously setting higher highs despite the overall market still being weak.
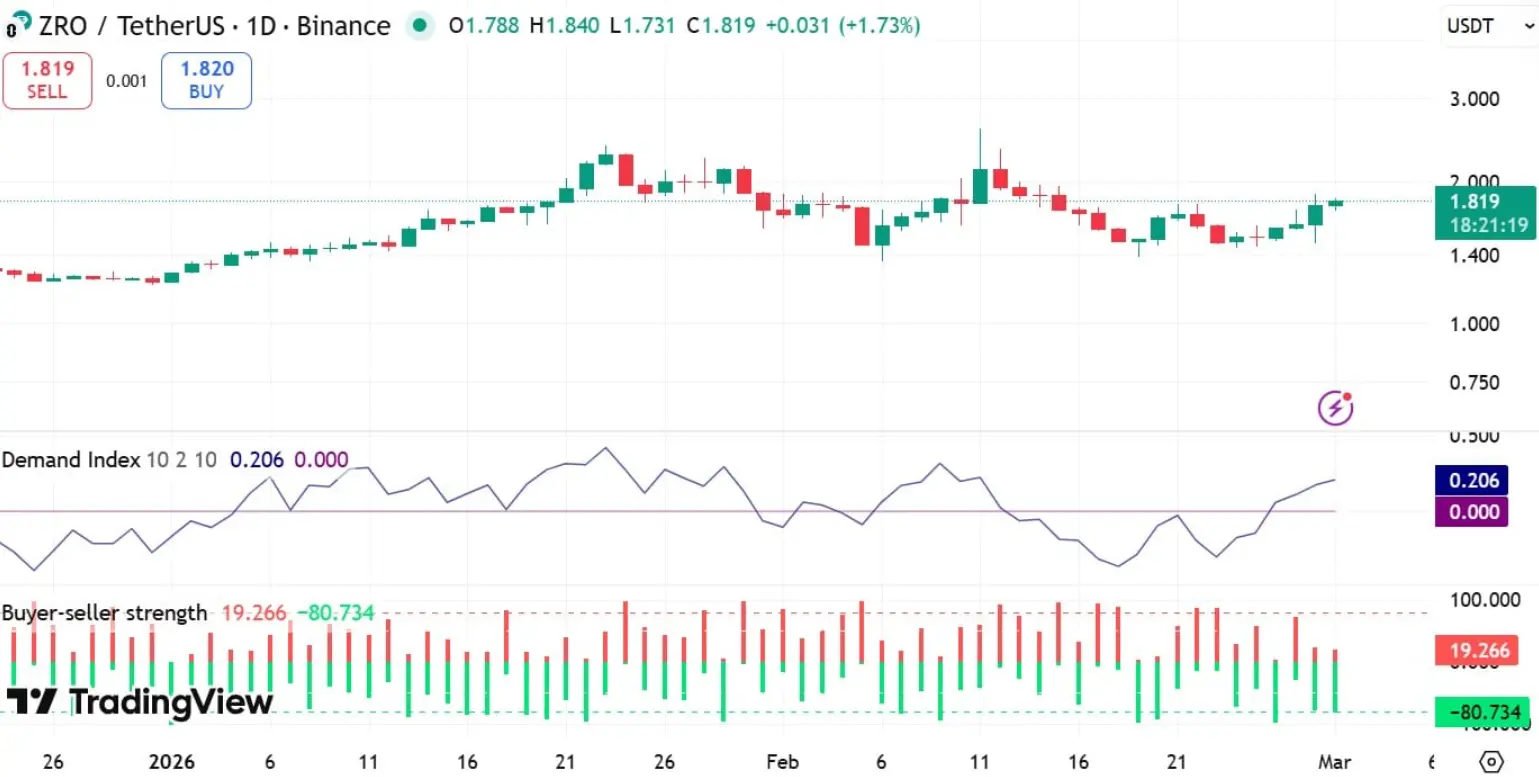
This altcoin previously surged to $1.88 before entering a slight correction. At the time of writing, ZRO is trading around $1.81, up 1.29% for the day.
Notably, the price remains in an upward structure, indicating persistent buying pressure. Each correction quickly attracts buyers back, significantly reducing the risk of sharp declines.
LayerZero’s Momentum Indicators Turn Bullish
Earlier, LayerZero (ZRO) fell to around $1.30 during the late February correction. However, quick dip-buying activity helped stabilize the price early on.
The Buy-Sell Strength indicator shows a clear dominance of bulls, with this metric approaching 80, while bearish strength remains below 25. This imbalance persisted until February 28, indicating that buying momentum continued to lead.
Meanwhile, the Demand Index surged from 0.058 to 0.206, confirming that accumulation pressure is returning to the market. Historically, a steadily expanding Demand Index often signals an early indication of a sustainable uptrend.
From a momentum perspective, the Stochastic RSI rose to 86.73, entering overbought territory. However, in strong uptrends, this indicator can remain high for some time before a significant correction occurs.
 Source: TradingView The Aroon indicator adds further technical insight: Aroon Down remains at 0%, while Aroon Up is at 28.57%. This structure suggests the trend is in a recovery phase rather than a confirmed breakout.
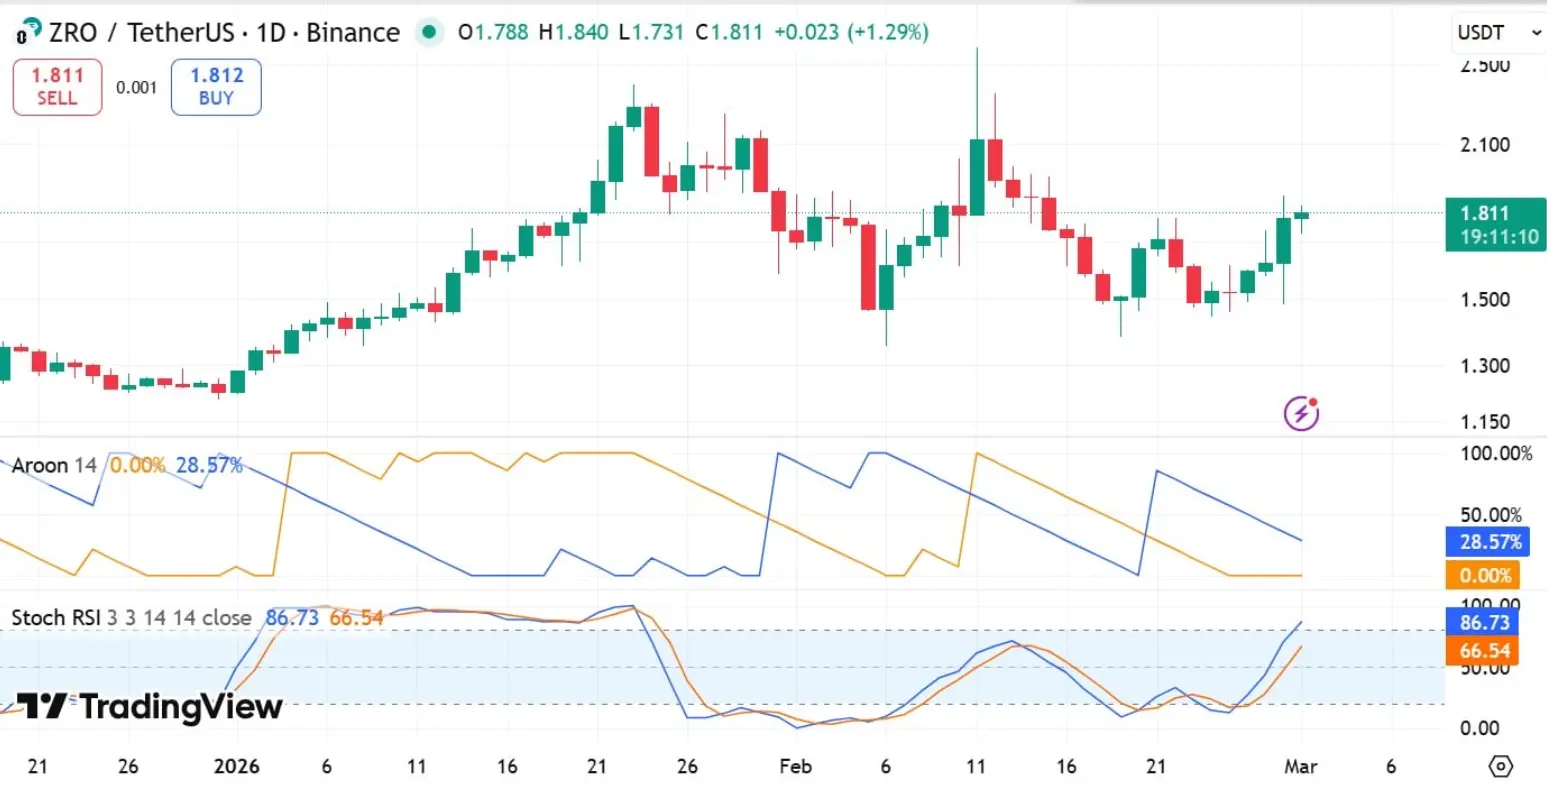 Source: TradingView These signals have traders paying close attention to the key resistance zone around $2.00. If current momentum is maintained, ZRO could test this level again and even extend gains toward $2.50. Conversely, if the technical structure weakens, the support zone near $1.50 may be challenged again.
Although the short-term outlook leans positive, profit-taking risks still exist. Investors who are “stuck” from the previous decline might use the rebound to sell, creating resistance to further price increases.
On-Chain Demand Remains Strong
Supported not only by positive technical signals, network data also reinforces the stability of the price.
Over the past month, the Price DAA Divergence indicator has consistently remained in positive territory, signaling that user activity growth is outpacing the price increase.
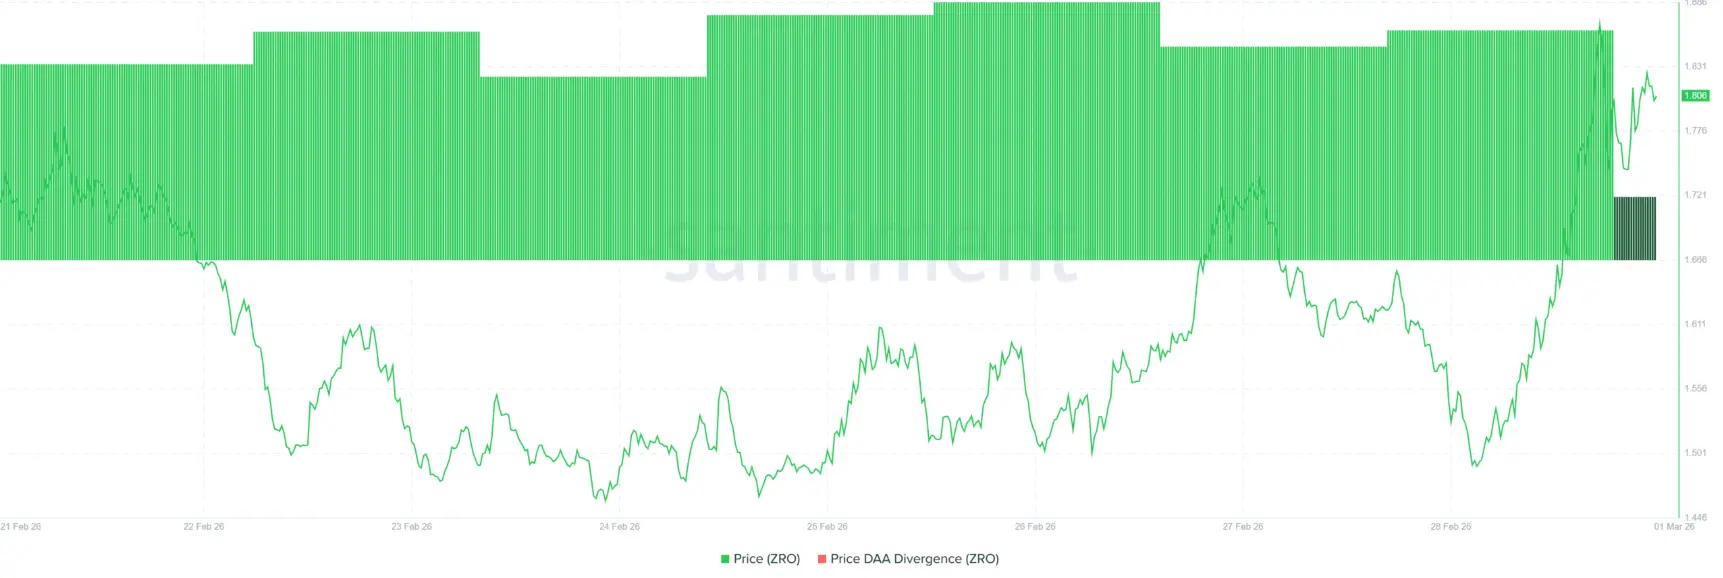 Source: Santiment Even during market corrections, on-chain activity levels stay high. This reflects steady new user participation, indicating the asset’s appeal remains strong. In other words, despite increased network usage, the price has yet to fully reflect this potential—a sign that the asset may be undervalued relative to the ecosystem’s expansion rate.
Historically, periods where market structure shows long-term capital accumulation like this often precede significant breakout rallies.
Therefore, the upward trend of this altcoin is likely to continue as long as on-chain activity remains high and stable.
Related Articles
3 Promising Crypto Picks That Could Skyrocket in 2026 — SOL, MNT, and LINK
Here’s How High Hedera (HBAR) Price Could Go This Week?
'Ponzi Scheme': Saylor's Strategy's New Dividend Policy Raises Criticism - U.Today
Bitcoin Drops Below $64K Amid Middle East Tensions
Polygon (POL) faces life-or-death threshold $0.90: Can the trend be reversed?