Aster (ASTER) To Soar Higher? This Emerging Bullish Fractal Setup Suggests So!

Key Highlights
-
ASTER trades in the green as on-chain activity remains strong among perpetual DEXs.
-
Aster ranks 2nd in 30-day perpetual volume at $135.85B, just behind Hyperliquid, per DefiLlama data.
-
Bullish fractal setup emerges, mirroring DASH’s recent breakout structure on the 4H chart.
-
ASTER is holding wedge support near $0.68, a critical level for maintaining the bullish structure.
-
A decisive reclaim of the 200-period MA at $0.7501 could trigger upside continuation.
Aster (ASTER), the native token of the Aster perpetual DEX, is trading in the green over the past 24 hours, showing early signs of strength as broader market conditions stabilize. While price action remains relatively muted for now, a deeper look at both on-chain data and technical structure suggests that ASTER may be positioning for a upside move.
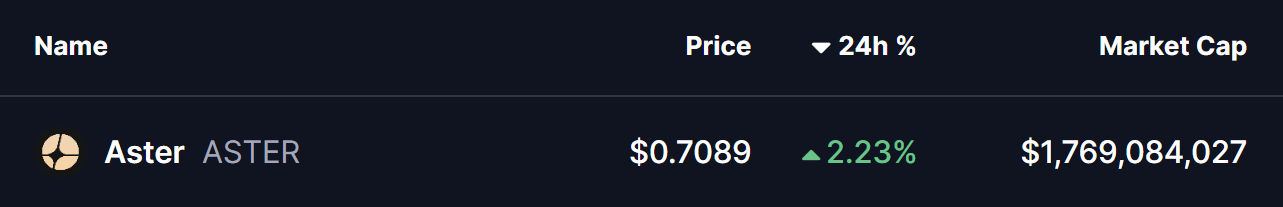
Source: Coinmarketcap
Notably, ASTER’s current price behavior is beginning to resemble a bullish fractal pattern that recently played out on Dash (DASH) — a setup that ultimately led to a sharp breakout rally. If this structure continues to develop, ASTER could be preparing for a similar upside expansion.
ASTER Leads in On-Chain Perpetual Metrics
Aster continues to stand out among decentralized perpetual exchanges. According to live data from DeFiLlama, Aster recorded approximately $135.85 billion in 30-day perpetual trading volume, ranking second across the sector. Hyperliquid currently holds the top position with $147.18 billion, while Lighter trails in third place.
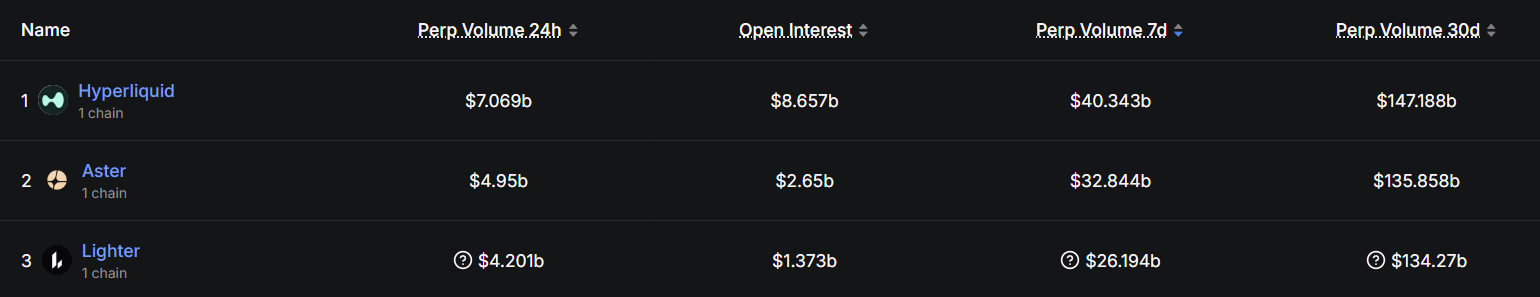
PERP Trading Volume/Source: Defillama
This sustained trading activity highlights strong user engagement and liquidity on the platform — an important foundation that often precedes meaningful price movements in native tokens.
ASTER Mirrors DASH’s Breakout Structure
From a technical perspective, ASTER’s chart structure is drawing increasing attention. On the 4-hour timeframe, DASH recently completed a bullish breakout after forming an ascending broadening wedge — a reversal pattern commonly seen during trend transitions.
DASH first bounced from wedge support, reclaimed its 200-period moving average, and then broke above the upper boundary of the structure. This sequence triggered a powerful rally of nearly 87% from local lows.
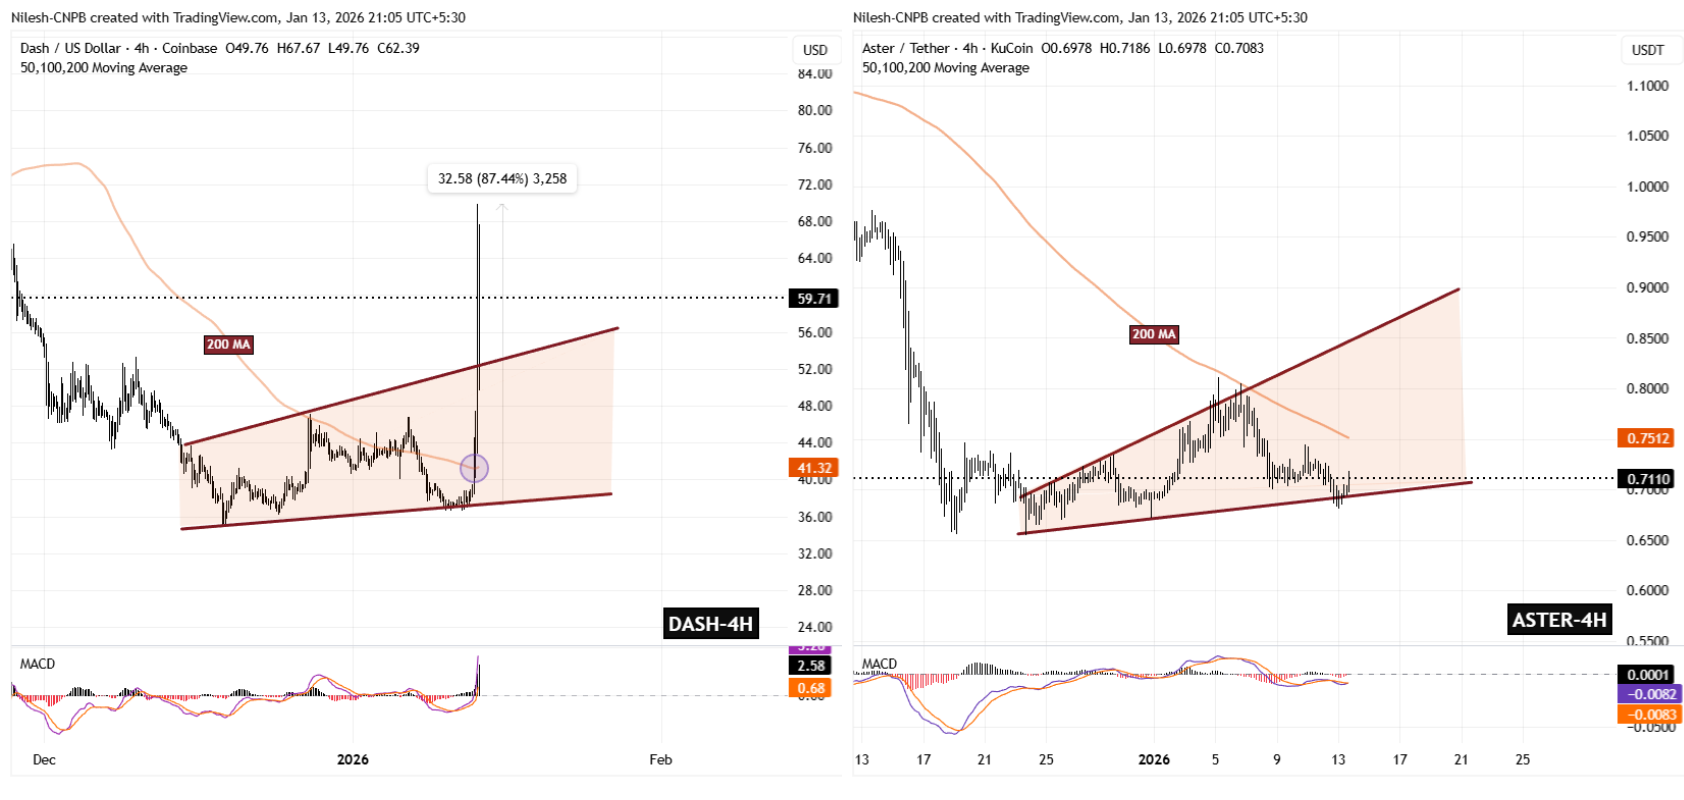
DASH and ASTER Fractal Chart/Coinsprobe (Source: Tradingview)
ASTER now appears to be following a similar roadmap.
Key Levels on the ASTER Chart
On the 4H chart, ASTER is currently respecting a rising wedge support around $0.68, keeping the broader bullish structure intact. However, the token remains capped by a major technical hurdle — the 200-period moving average near $0.7501, which has acted as dynamic resistance.
This compression between rising support and overhead resistance suggests that a decisive move may be approaching.
What’s Next for ASTER?
For bullish confirmation, ASTER needs a clean reclaim of the 200 MA at $0.7501. A sustained move above this level could allow price to test the upper boundary of the wedge and potentially trigger an acceleration phase — similar to what was observed in DASH’s breakout.
On the downside, failure to hold the $0.68 wedge support would weaken the fractal comparison and could invalidate the bullish setup, pushing ASTER back into consolidation.
For now, ASTER sits at a technically sensitive zone. With strong on-chain dominance and a familiar breakout structure forming, the coming sessions may prove critical in determining whether this setup evolves into a sustained upside move.
Bottom Line
ASTER is approaching a technically important inflection point. With strong on-chain dominance in perpetual volume and a chart structure closely resembling DASH’s recent breakout, the setup favors a potential upside move — provided price holds wedge support and reclaims the 200 MA. While the fractal comparison strengthens the bullish case, failure to maintain the $0.68 support would invalidate the setup and delay any breakout scenario.
Frequently Asked Questions (FAQ)
What is Aster (ASTER)?
Aster is a decentralized perpetual futures exchange (Perp DEX), and ASTER is its native utility token used within the platform’s ecosystem.
Why is ASTER price rising today?
ASTER is trading higher due to strong on-chain activity, leading perpetual trading volume, and a bullish technical structure forming on the 4-hour chart.
What bullish pattern is forming on ASTER’s chart?
ASTER appears to be forming a bullish fractal setup similar to DASH’s recent breakout from an ascending broadening wedge pattern.
What is the key support level for ASTER?
The critical support level lies near **$0.**68, which aligns with the lower boundary of the wedge structure.
What resistance must ASTER break for upside confirmation?
ASTER needs to reclaim the 200-period moving average around $0.7501 to confirm bullish continuation.
Can ASTER repeat DASH’s breakout rally?
While no outcome is guaranteed, ASTER’s structure closely resembles DASH’s pre-breakout phase. Holding support and reclaiming resistance could increase the probability of a similar move.
Disclaimer: The views and analysis presented in this article are for informational purposes only and reflect the author’s perspective, not financial advice. Technical patterns and indicators discussed are subject to market volatility and may or may not yield the anticipated results. Investors are advised to exercise caution, conduct independent research, and make decisions aligned with their individual risk tolerance.
About Author: Nilesh Hembade is the Founder and Lead Author of Coinsprobe, with over 5 years of experience in the cryptocurrency and blockchain industry. Since launching Coinsprobe in 2023, he has been providing daily, research-driven insights through in-depth market analysis, on-chain data, and technical research.
Related Articles
Bitdeer liquidates a reserve of 943.1 BTC, is it the renowned mining company "Winter is Coming" or the AI sector's "Breakthrough and Rebirth"?
MICA Daily|Exchange BTC Reserves Continue to Increase, Is the Selling Wave Not Over Yet?
Next 100X Crypto Rally? 4 Altcoins Gearing Up for Parabolic Gains This Quarter
Shiba Inu Price Drops After Death Cross Signal Emerges
AAVE Price Before the New Turn: Opportunity or Risk in the Coming Period?
Bitcoin plunges to 65,000, Ethereum drops below $1,900, and the entire February market is in extreme panic.