FET traders continue to accumulate despite the downtrend
Fetch.ai (FET) is currently among the assets experiencing a strong downward trend in the market, as overall sentiment continues to weaken.
Although the price of FET has dropped by up to 11%, trading activity has seen a significant surge. Trading volume has skyrocketed by 145%, reaching approximately $145 million, indicating increasing interest and participation from investors.
This divergence between price and volume reflects the possibility that the current decline is merely a correction within a broader market context, with investors actively accumulating at low prices in preparation for a rebound.
Accumulation and buying activity remain stable
Notably, the market’s downward momentum has not yet been fully reflected in key technical indicators, which still show sustained buying strength.
The Accumulation/Distribution (A/D) indicator—measuring investor accumulation or distribution trends for FET—continues to lean toward accumulation, indicating that buyers still hold the advantage despite downward pressure.
Data from the 4-hour chart further supports this view, as total trading volume continues to increase, with accumulation reaching about 697 million FET at the time of the survey.
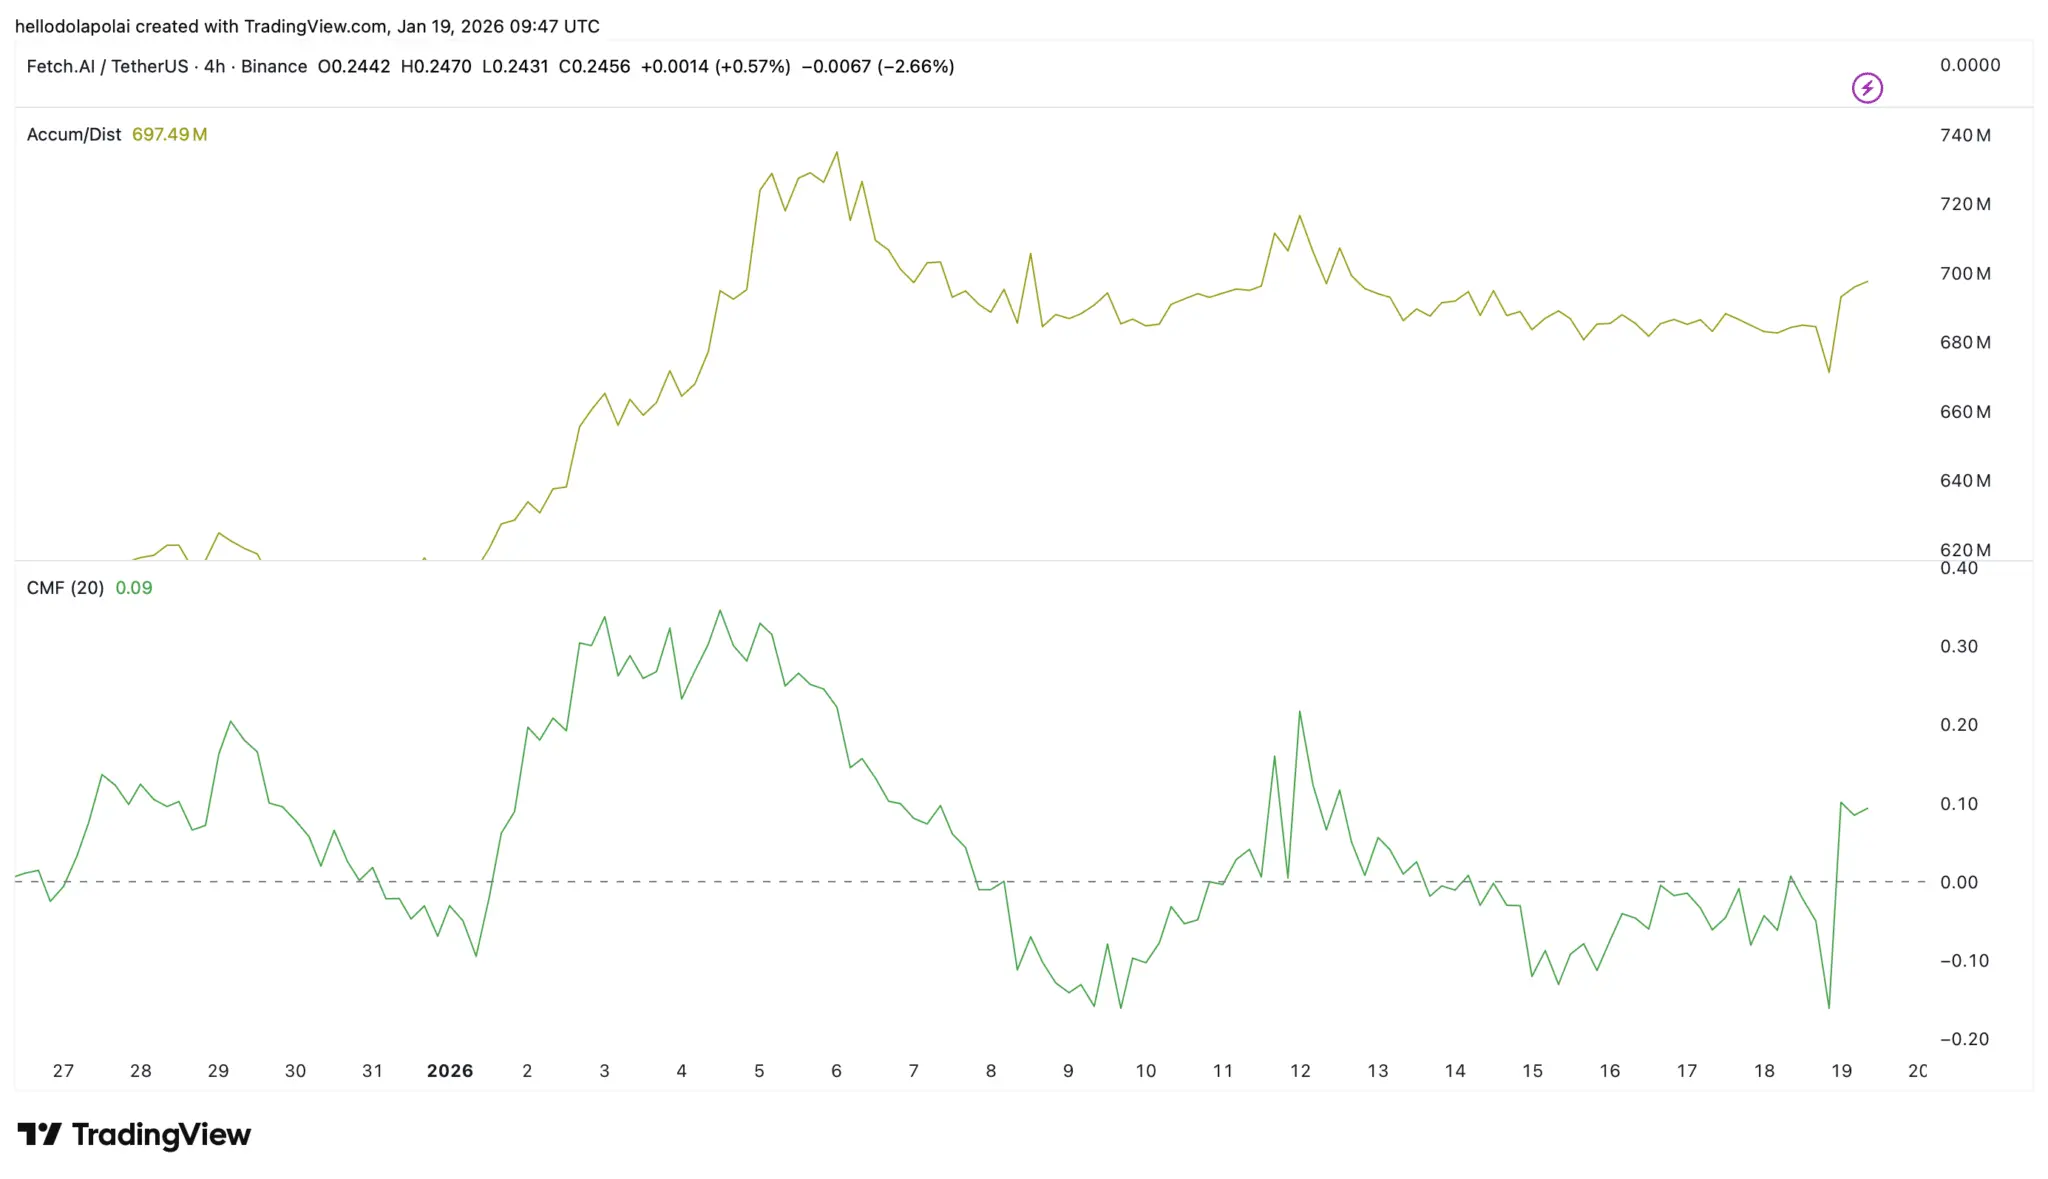 Source: TradingView Similarly, the Chaikin Money Flow (CMF) indicator, which tracks money flow into/out of the market, also shows that capital is still flowing into FET. At 0.09 (on a scale from -1 to 1, with 0 being neutral), the CMF reflects positive momentum, reinforcing expectations of an upward trend and indicating that buying pressure could still drive a recovery for FET, despite short-term selling pressure still present.
Doji candlestick pattern signals potential bullish reversal
On the price chart, FET has just formed a dragonfly doji pattern—a T-shaped candlestick often appearing at the end of a downtrend, signaling a possible reversal.
This pattern appears after a series of deep declines, continuously setting new lows. The appearance of the doji, combined with positive technical indicators, opens up prospects for a recovery for FET. However, the potential for a strong rally will depend on whether FET can break through key resistance levels.
The first resistance level is at $0.27—previously a support zone. If FET can regain this level and stay above it, it will be the first sign that investor confidence is returning.
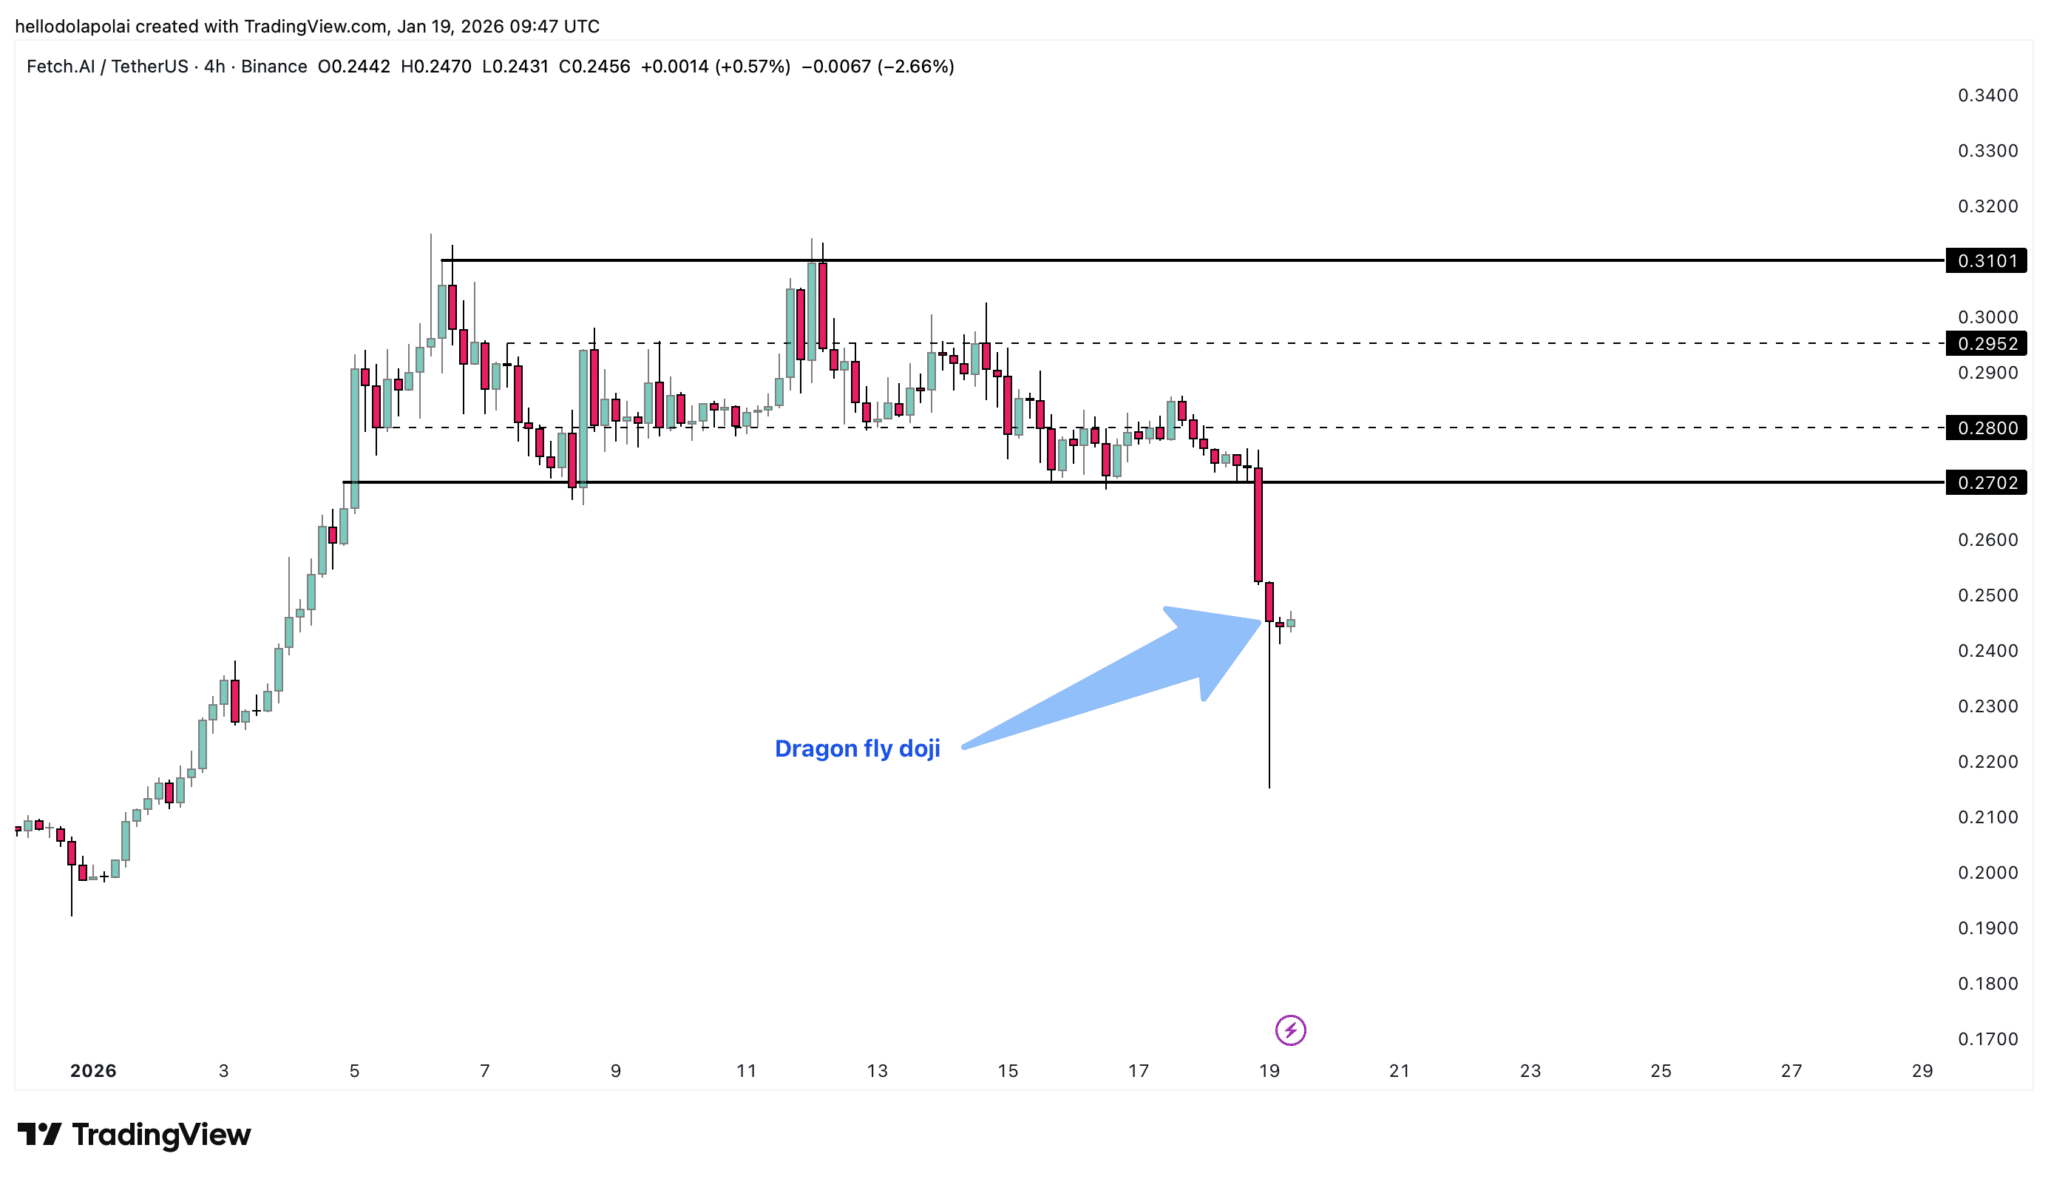
Between the two levels of $0.27 and $0.34 (the previous high), there are two significant intermediate resistance zones that could slow the upward momentum. Breaking through this entire zone will be a prerequisite for a sustainable bullish cycle.
Market overview of AI
On a broader scale, the artificial intelligence segment within the cryptocurrency market—where FET is classified—is currently experiencing a short-term underperformance.
The total market capitalization of AI tokens has decreased by 1.79%, down to $19.64 billion, continuing the decline that began around January 15. This weakness reflects overall cautious market sentiment rather than specific pressure on individual tokens.
However, in the long term, the AI token market still maintains a positive foundation. Market capitalization has increased by 16.59%, with trading volume remaining at $3.34 billion.
FET’s current behavior may represent a short-term correction within a long-term restructuring trend. With increasingly strong accumulation indicators and reversal signals appearing on the chart, it is highly likely that downward pressure will soon give way to new growth momentum in the near future.
Mr. Giáo
Related Articles
PEPE Jumps 2.3% With $337M Volume Surge — Is $0.054135 the Next Breakout Trigger?
Dogecoin Price Compresses Near $0.10 as Open Interest Drops
NEAR Surges 14.5% — Will a Break Above $1.25 Ignite a Run Toward $3–$4?
SHIB Tests $0.0560 Resistance as Broader Altcoin Cycle Extends Toward 2026
PIPPIN Surges Past $0.76 — $0.8472 Break or Pullback to $0.6715 Next?
PEPE Holds $0.053796 Support After 12% Drop Amid $580M Trading Spike