XRP is on the verge of a sharp correction if it loses the psychological support level of $2
The on-chain market structure of XRP is repeating a pattern that led to a sharp decline in 2022, when the price lost a critical support level.
Old signals that predicted XRP’s 68% drop
According to data from Glassnode, XRP’s current market structure “closely resembles the February 2022 period,” which marked the beginning of several months of prolonged weakness.
Glassnode analysis: “XRP investors operating on a weekly to monthly timeframe are currently accumulating at lower prices than the cost basis of holders from 6 to 12 months ago.”
This creates a situation where new investors are in profit, while medium-term holders are incurring losses. This gap gradually builds selling pressure if key support levels are not recovered.
Glassnode further comments:
“When this structure persists, psychological pressure on investors buying at higher prices will increase.”
A similar pattern appeared in February 2022, when XRP traded around $0.78, then sharply declined 68% to $0.30 by June 2022.
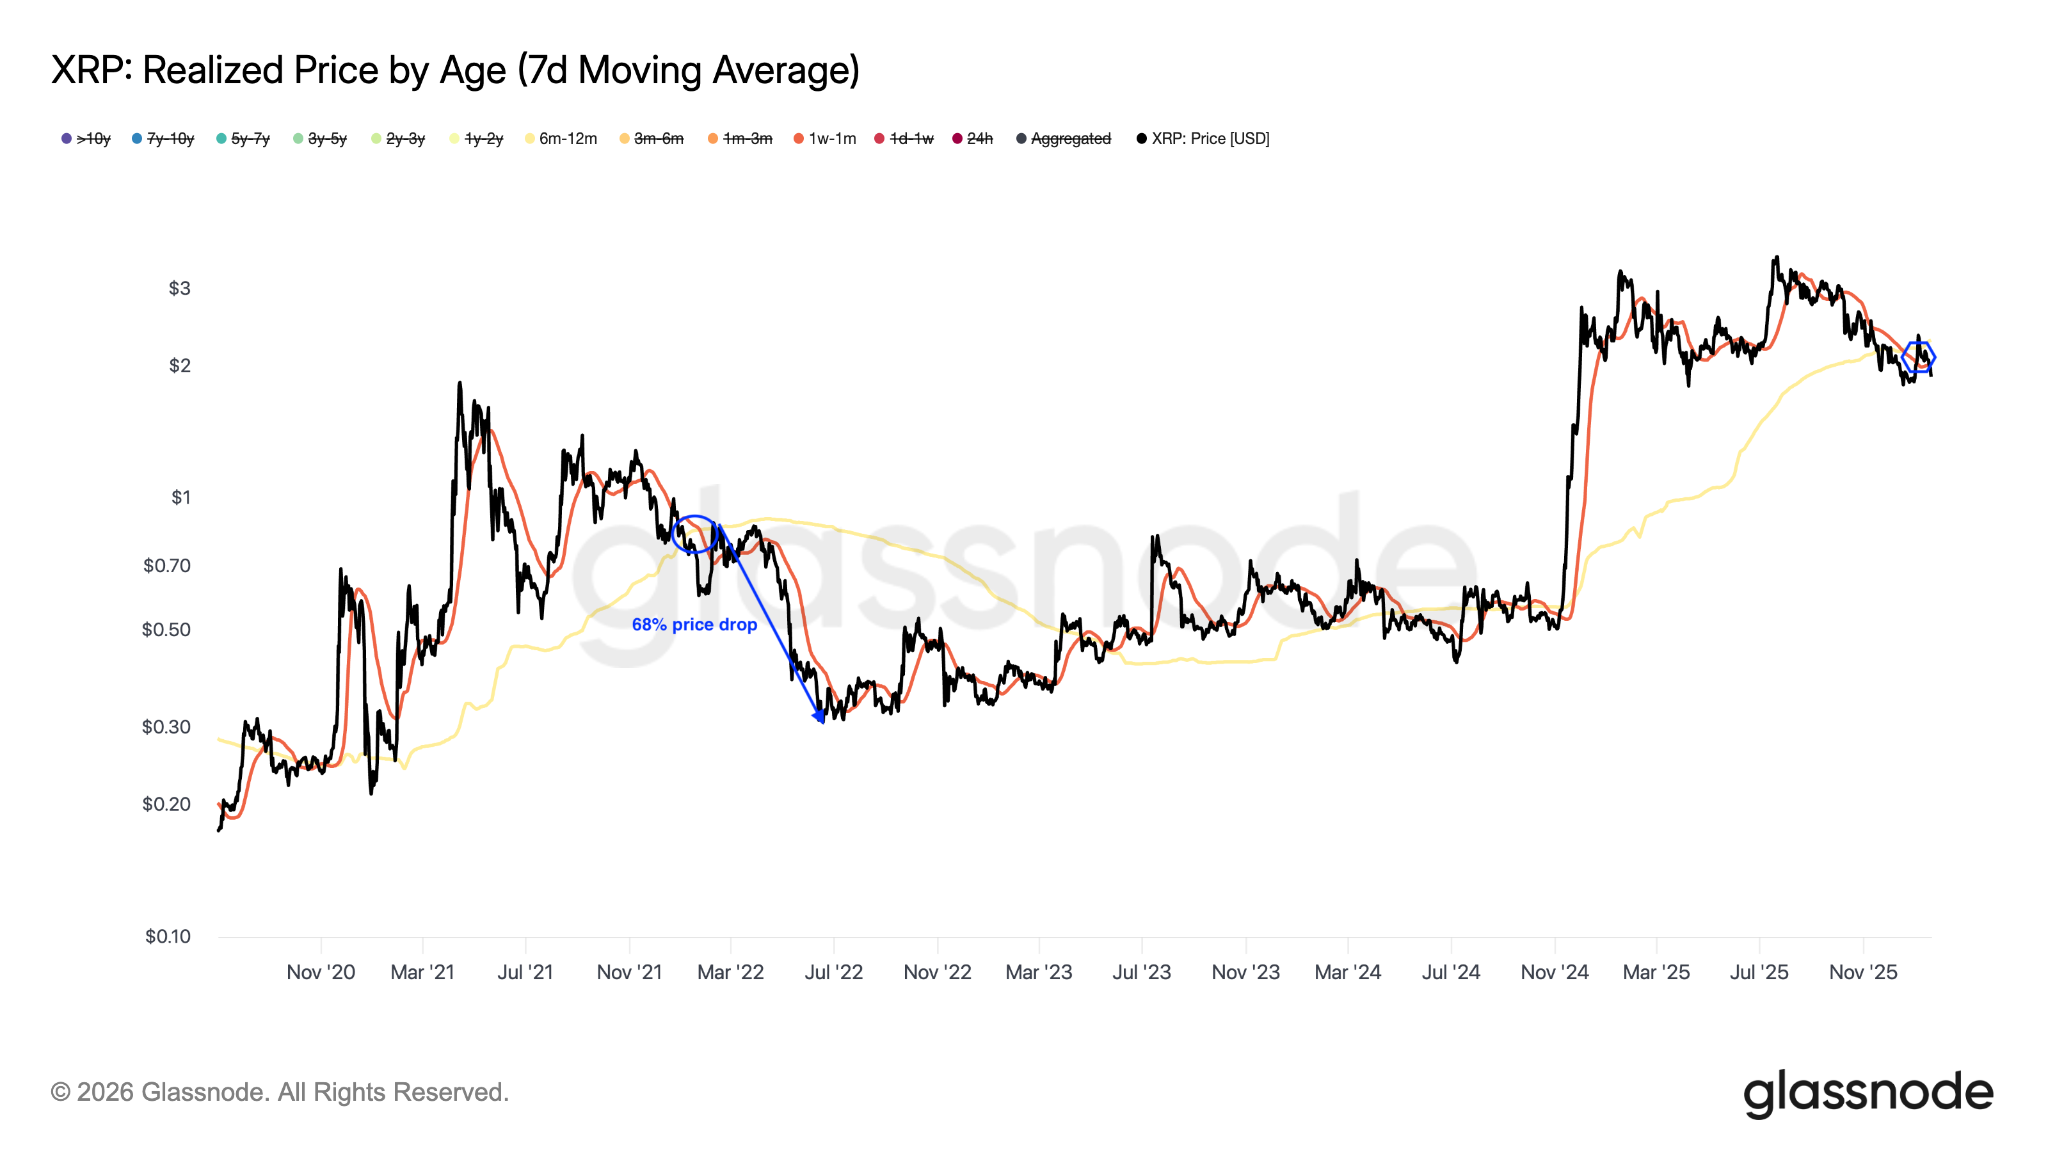 Real XRP Price | Source: Glassnode If history repeats, XRP could drop sharply to $1.40 if the support zone from $1.80 to $2 is broken.
The price level $2 becomes an important psychological zone
The price level $2 currently acts as a significant psychological threshold for XRP in the short and medium term. According to previous analysis by Glassnode, each time the $2 level has been tested since early 2025, it has resulted in realized losses of between $500 million and $1.2 billion per week, indicating many investors have chosen to cut losses and exit the market.
“This shows that this price level has a major impact on investor trading behavior.”
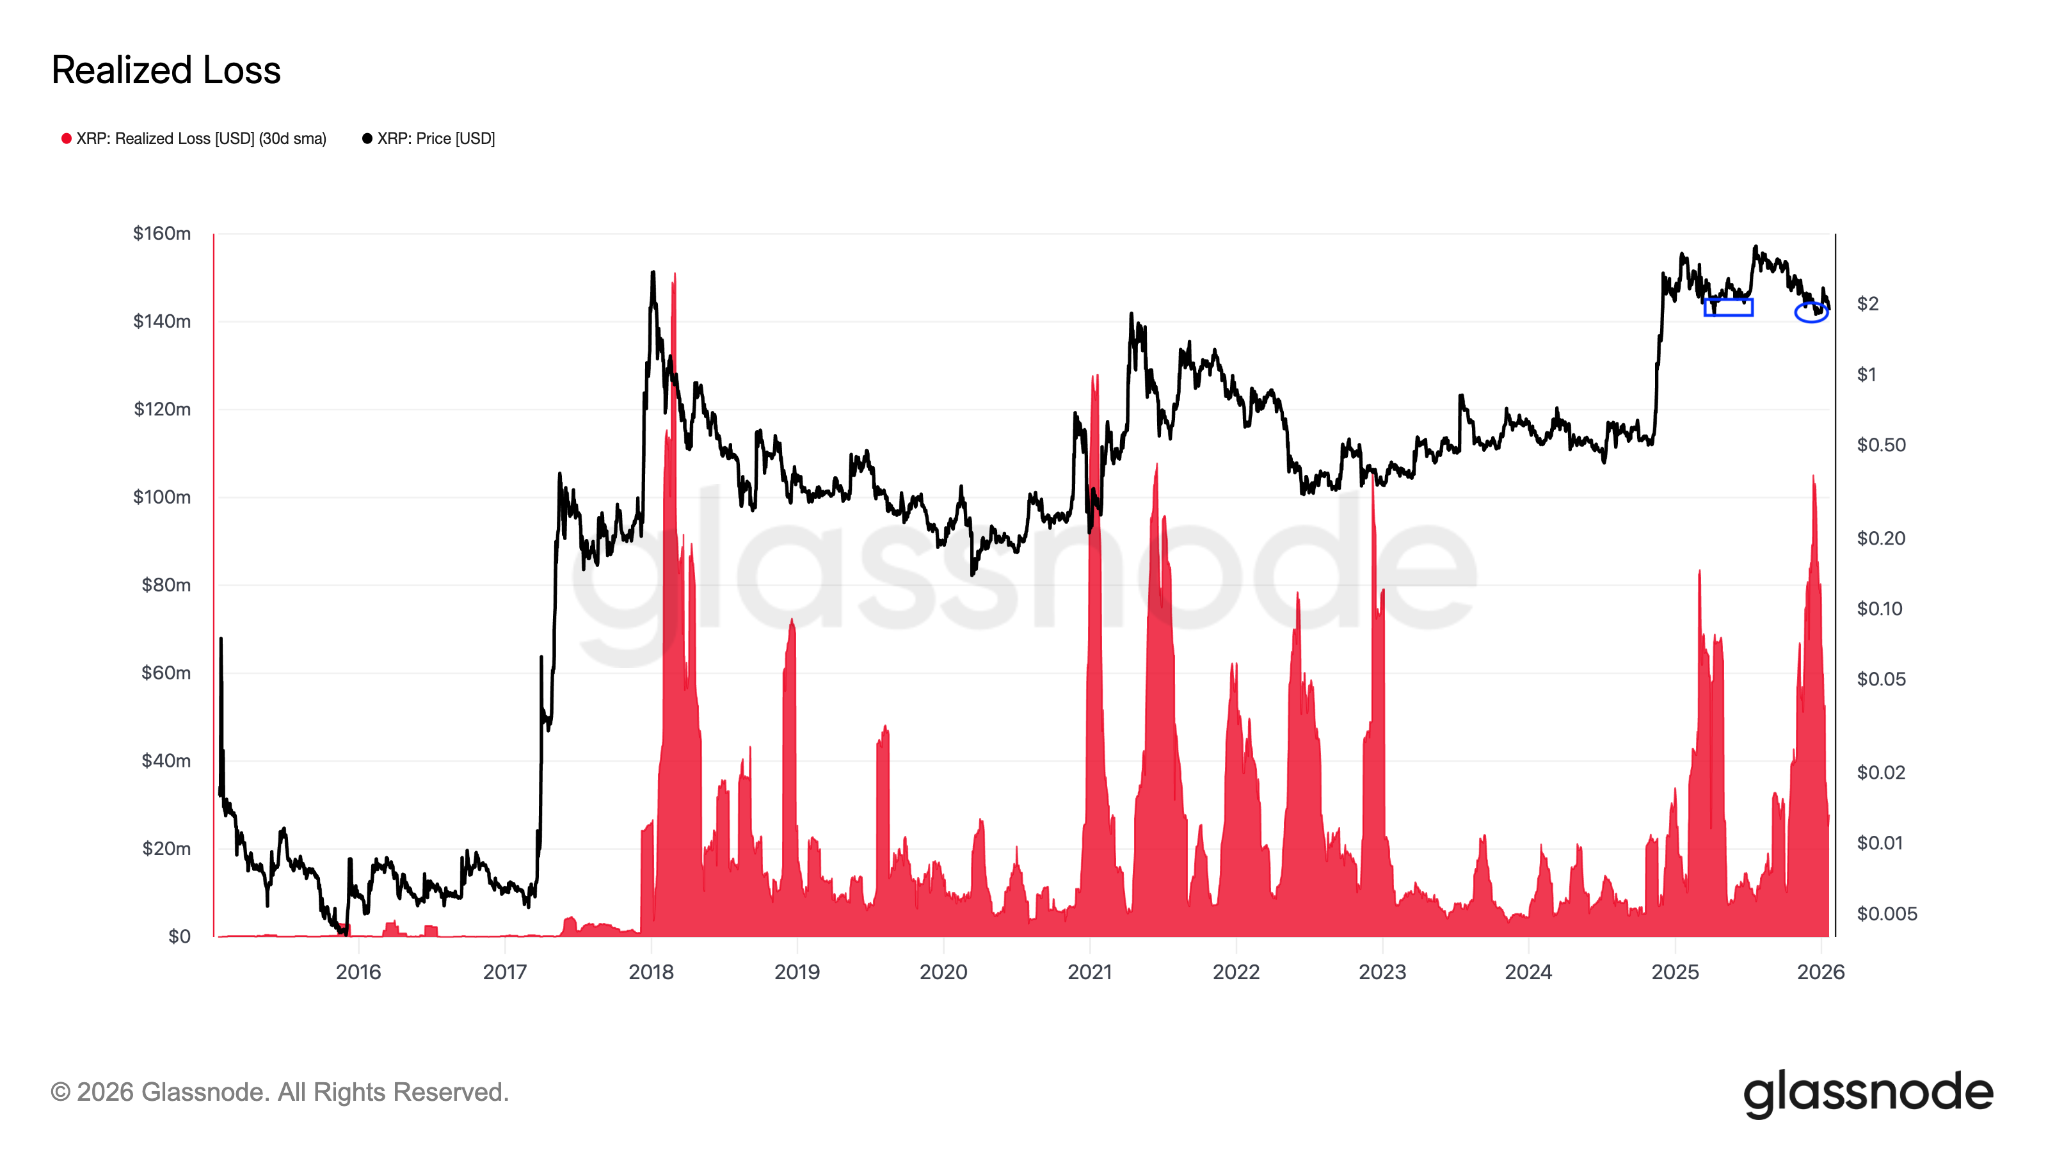 XRP has incurred losses | Source: Glassnode When the price drops below $2, selling pressure will increase among those who bought at higher levels, while new investors will accumulate at lower prices.
The 2022 fractal pattern further emphasizes the importance of this threshold, suggesting XRP could continue to correct deeply if it does not regain the support zone soon.
For example, the $0.55 level was a key support zone in the past, maintaining the price from April 2021 to May 2022. However, each test weakened the support, and ultimately this zone was broken in May 2022, leading to a 48% decline to $0.28.
Similarly, if the $2 support zone is lost, XRP could enter a downtrend, with a potential bottom below the 200-week moving average at $1.03, as happened in 2022.
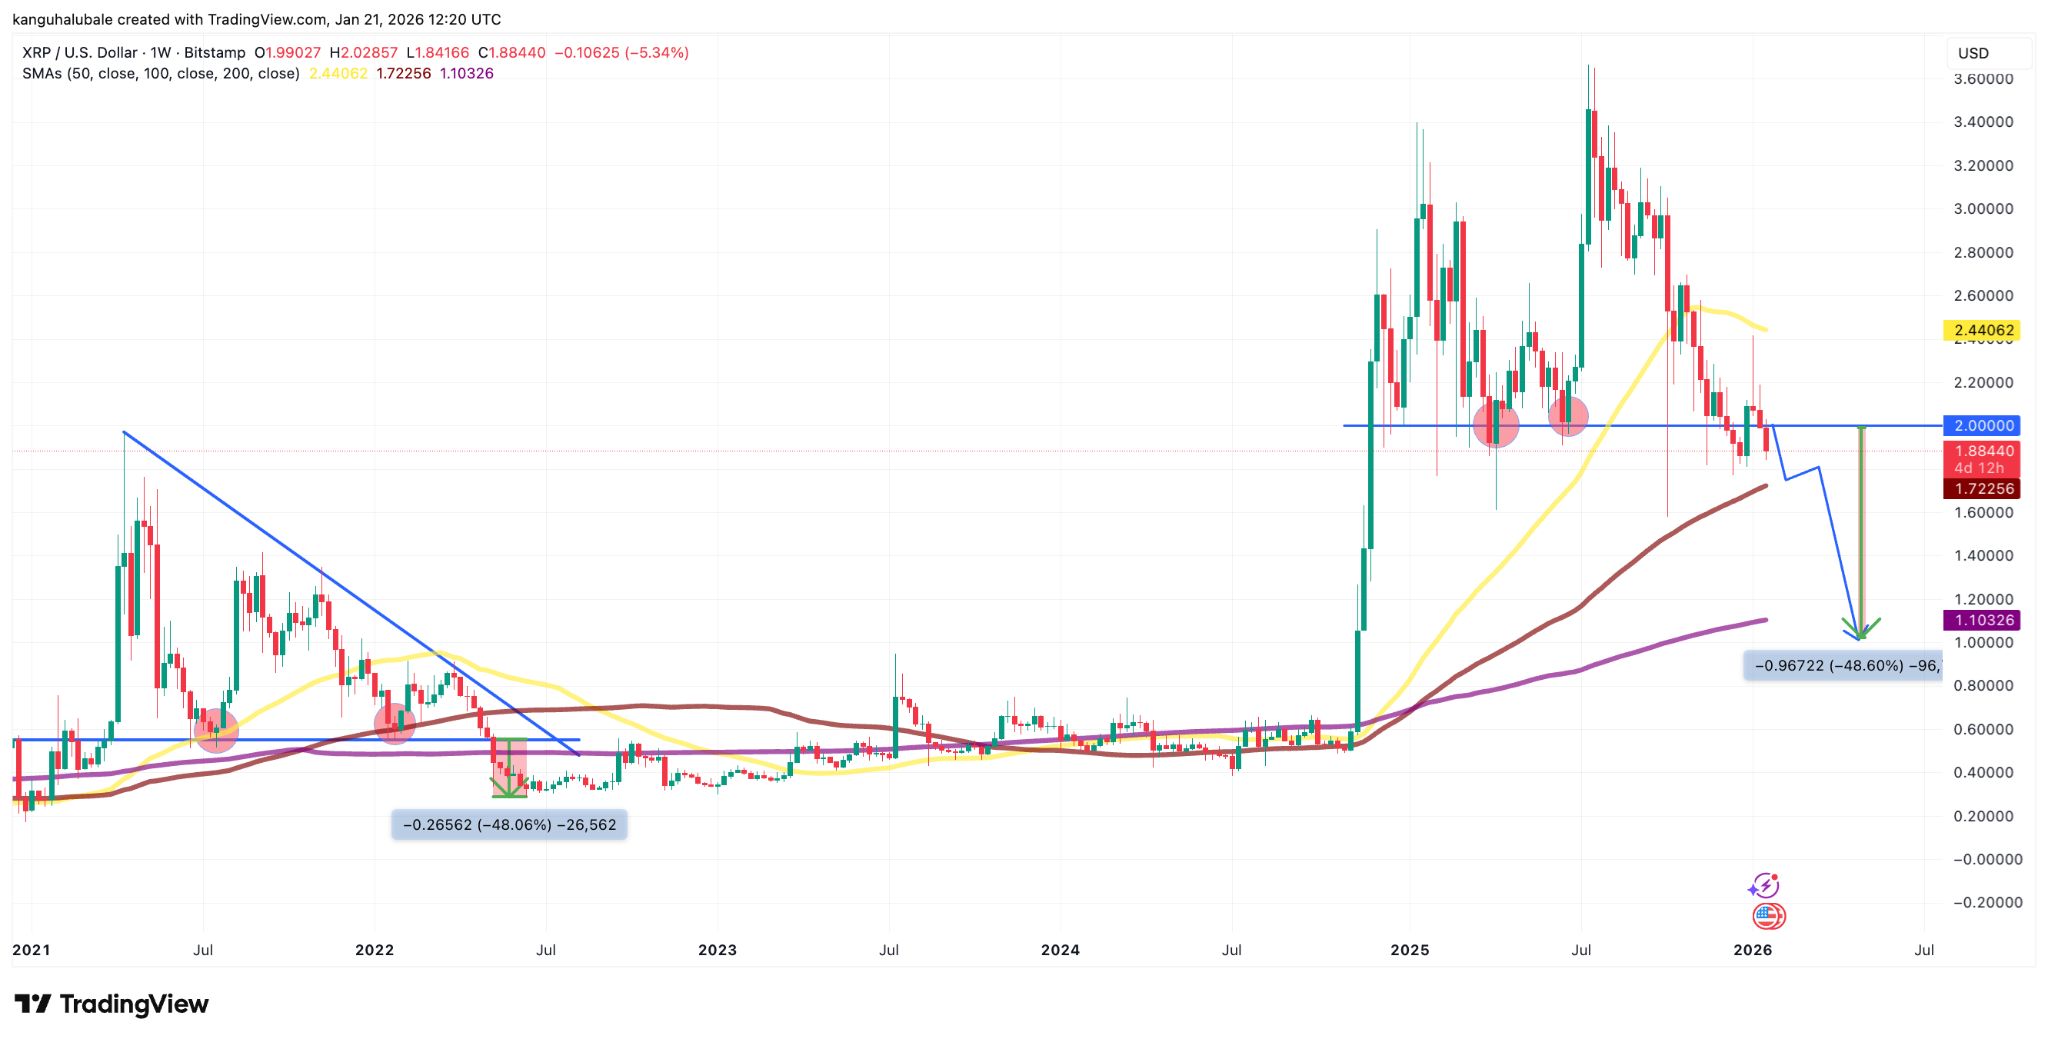 Weekly XRP/USD chart | Source: TradingView According to Cointelegraph, breaking below the 50-day simple moving average (SMA) at $2 signals that the sellers have returned, and downside risk could extend to the $1.25 level.
XRP ETF records second consecutive day of capital outflows
According to data from SoSoValue, spot XRP ETF funds experienced a second consecutive day of outflows since launch, totaling $53 million on Tuesday. This figure is higher than the $13 million outflow on January 7, which was the only previous outflow.
![XRP đứng trước ngưỡng cửa điều chỉnh mạnh nếu mất mốc hỗ trợ tâm lý $40 ]$2 https://img-cdn.gateio.im/webp-social/moments-c1c4c917cf6da640c1aea50aba364c0c.webp(Flow chart of spot XRP ETF trading | Source: SoSoValue These outflows reflect caution among institutional investors or profit-taking amid a weakening crypto market and increasing risk aversion, further adding to selling pressure.
Mr. Giáo
Related Articles
The US SEC will decide this month whether to approve the T. Rowe Price Active Crypto ETF
'What Did I Do?': Ripple CTO Emeritus Reacts to XRP Community's Rage Against Wallet Fees - U.Today
Ju.com completes the third phase of the SOL 20% discount Launchpad event, and the fourth phase XRP is scheduled to launch on February 19.
Franklin Templeton's XRP ETF Holds Over 118 Million Tokens - U.Today