HBAR sideways: Derivative data indicates a weak recovery
Hedera (HBAR) is trading below $0.101 at the time of writing on Wednesday, after failing to break through the key resistance zone at the end of last week. Derivatives market data indicate that HBAR’s recovery potential remains quite fragile: open interest (OI) continues to decline, and the funding rate remains negative, reflecting cautious investor sentiment. In this context, current technical signals do not support a clear bullish scenario for Hedera.
Hedera Derivatives Data Shows Downtrend
Hedera futures open interest (OI) dropped to $104.58 million on Wednesday, extending the weakening trend that began in early January. Notably, this indicator is approaching the February 6 low of $88.89 million. The prolonged decline in OI suggests decreasing participation from investors and indicates a less optimistic short-term price outlook.
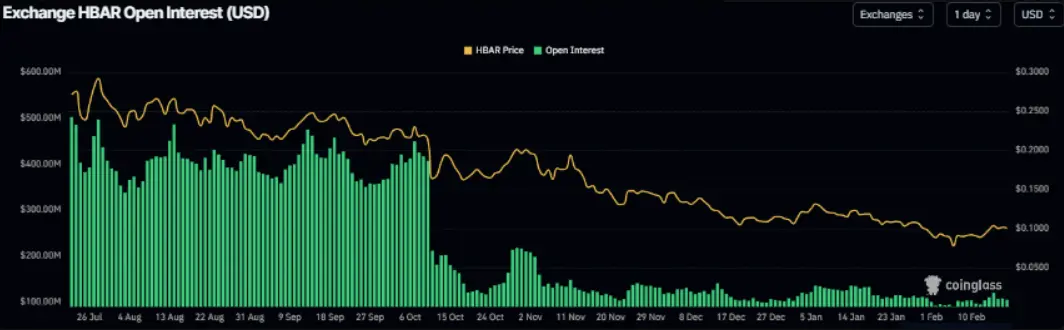 HBAR Open Interest Volume Chart | Source: CoinglassAdditionally, the funding rate data, weighted by OI from Coinglass, shows that the bearish prediction for Hedera continues to dominate over bullish expectations. The indicator turned negative on Monday and fell sharply to -0.011% on Tuesday. Negative funding rates mean short positions pay fees to long positions, emphasizing the prevailing bearish market sentiment toward HBAR.
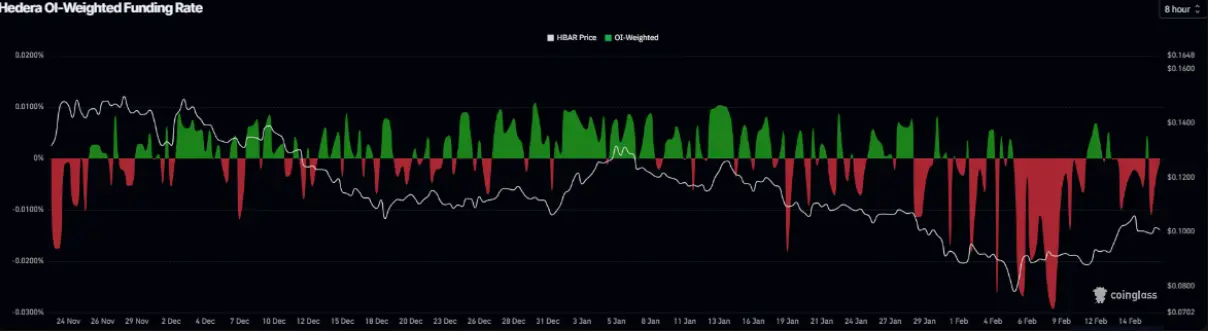 HBAR Funding Rate Chart | Source: Coinglass## Hedera Price Forecast: Rejected at Key Resistance Zone
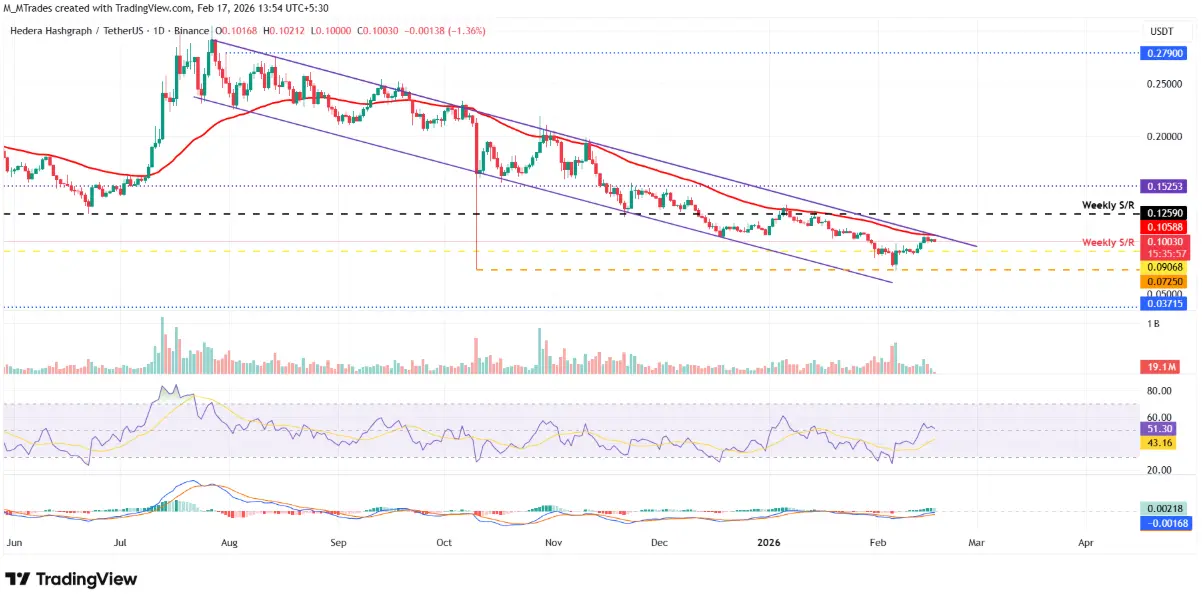
Hedera’s price faced strong selling pressure around the 50-day exponential moving average (EMA) at $0.105 on Saturday, before slightly retracing in the following session. Notably, the 50-day EMA nearly coincides with the upper trendline of a descending wedge pattern — formed by connecting the peaks and troughs since late June — reinforcing this zone as a significant resistance area. As of Wednesday, HBAR is trading around $0.010.
In a continued correction scenario, HBAR’s price is likely to retreat toward the weekly support zone at $0.090. If selling pressure is strong enough to close below this level, the decline could extend to the next support at $0.072 — the low established on October 10.
 Daily HBAR/USDT Chart | Source: TradingView
Regarding momentum, the relative strength index (RSI) on the daily timeframe is currently around 51 and trending downward toward the neutral 50 level, indicating that buying power is gradually waning. For a sustained downtrend, RSI would need to break below this neutral threshold. On the positive side, the MACD indicator still shows a bullish crossover triggered on February 10, suggesting that the upward trend has not been entirely invalidated.
Conversely, if HBAR regains momentum and successfully closes above the 50-day EMA at $0.105, the price could continue upward to test the next weekly resistance zone around $0.125.
Related Articles
Geopolitical Shock Sends Markets and Crypto Reeling
BTC 15-minute sharp decline of 1.60%: Bullish liquidation and risk aversion sentiment intensify short-term selling pressure
Solana Compresses Beneath $90 After Sharp Range Reclaim
Uniswap Price Eyes $4.60 as Fee Burn Vote Advances
PEPE Slides Within Tight 24H Range — Will Momentum Hold as $0.053891 Caps Gains?
XRP Reclaims $1.39 After $1.69M Liquidation Spike — Can Price Break $1.43 Today?