
Key Takeaways
-
Aster (ASTER) has hit a new all-time low near $0.54 amid a broader crypto market sell-off.
-
The current price structure closely mirrors Hyperliquid (HYPE)’s 2025 bottoming fractal, which preceded a 200%+ rally.
-
ASTER is forming a potential rounding bottom after a ~77% drawdown from its peak.
-
A reclaim of the 50-day moving average near $0.79 could signal early trend reversal.
-
The activation of ASTER’s Strategic Buyback Reserve may help stabilize price and reduce circulating supply.
As of January 19, 2026, Aster (ASTER) is under heavy pressure, printing a fresh all-time low at $0.5420. The sharp drop comes amid a broader market sell-off triggered by escalating US–EU trade tensions, which wiped out nearly $875 million in leveraged long positions across crypto. Bitcoin (BTC) and Ethereum (ETH) are both down 2–3% on the day, and smaller-cap tokens like ASTER have taken the brunt of the impact.
ASTER has now fallen more than 12% in the past 24 hours, but beneath the surface, the price structure is beginning to tell a more nuanced story. Interestingly, the current setup closely resembles the bottoming fractal previously seen in Hyperliquid (HYPE) — a structure that ultimately preceded a powerful upside reversal.
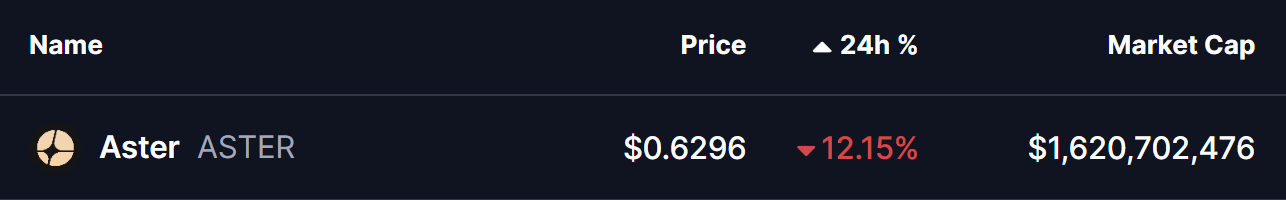
Source: Coinmarketcap
ASTER Mirrors HYPE’s Bottoming Path
A closer look at the comparative chart reveals striking similarities between ASTER’s current price action and HYPE’s April 2025 bottoming phase.
HYPE’s move started with a sharp correction following its all-time high. Price slipped below the 50-day moving average, signaling a momentum shift. Instead of continuing lower aggressively, HYPE entered a rounding bottom structure, reflecting gradual seller exhaustion. The final low came after a deep 73% drawdown from the peak, marking a clear inflection point in market sentiment.
What followed was critical. HYPE reclaimed both the 50-day and 100-day moving averages, confirming a trend shift. That technical reclaim ignited a breakout from the rounding base, leading to a 207% rally — one of HYPE’s most notable reversals of 2025.
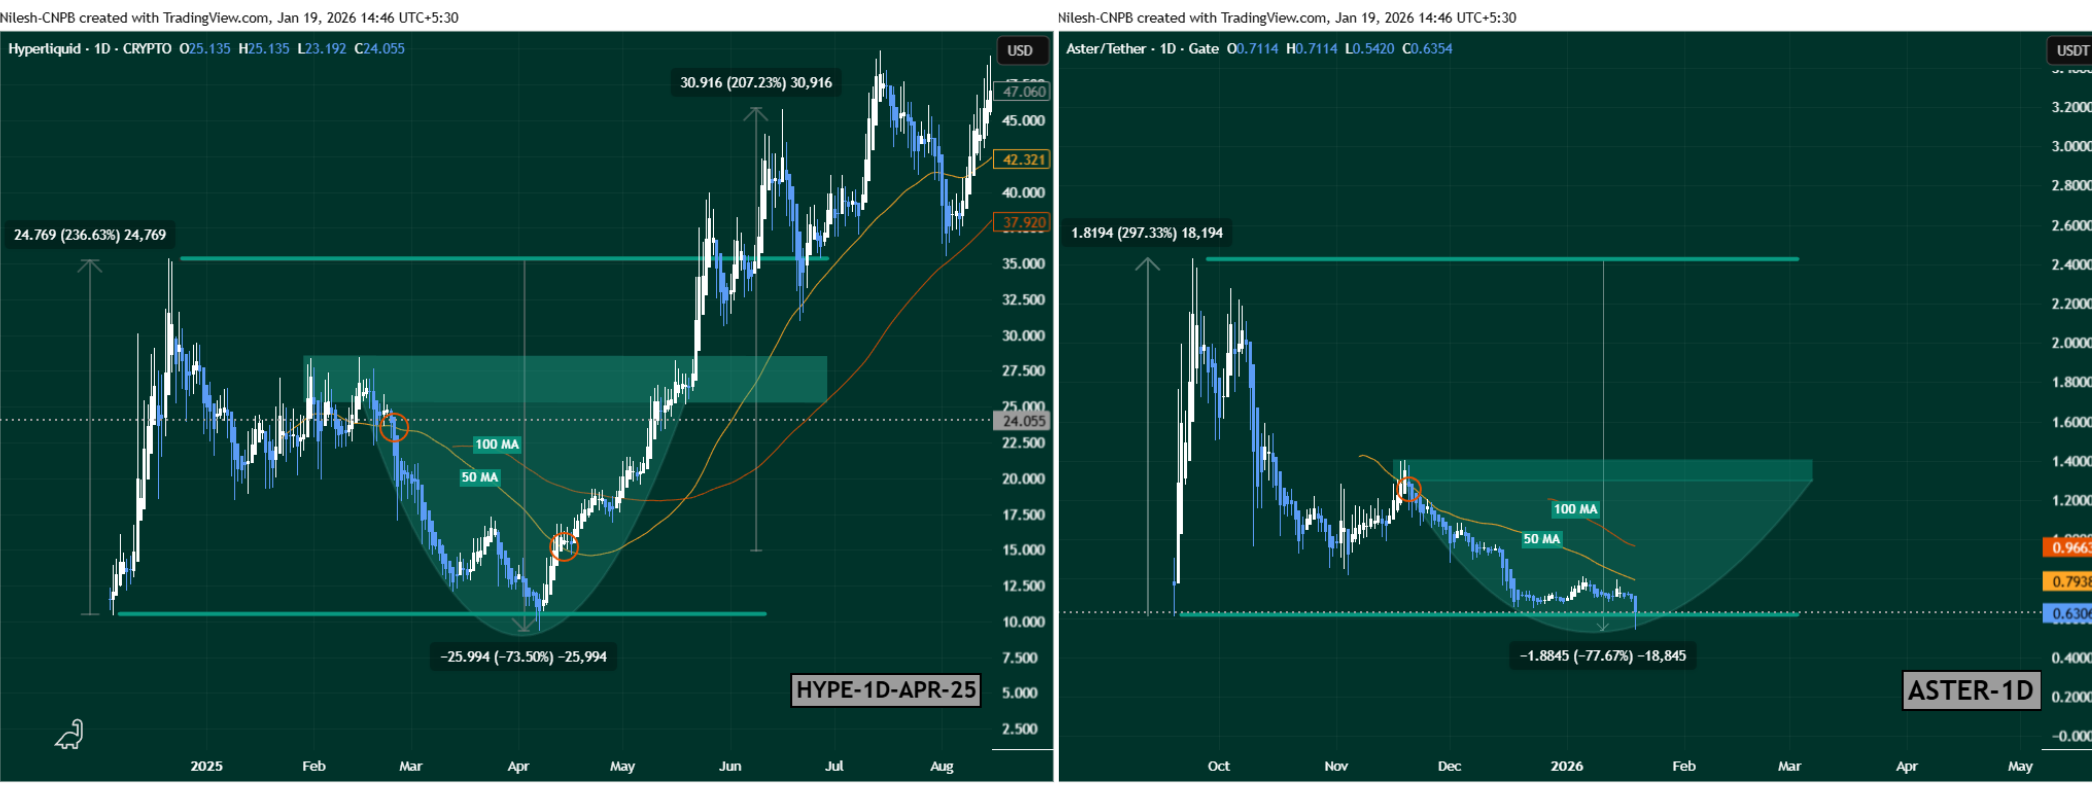
HYPE and ASTER Fractal Chart/Coinsprobe (Source: Tradingview)
ASTER now appears to be walking a similar road.
After topping near its all-time high around $2.42, ASTER entered a prolonged corrective phase and lost its 50-day moving average. Price has since been carving out what looks like a rounding bottom, with today’s low near $0.54, representing a steep 77% drawdown from the top. The structure, momentum loss, and gradual flattening strongly resemble HYPE’s pre-reversal behavior highlighted in the fractal comparison.
What’s Next for ASTER?
If this fractal continues to unfold, ASTER may be approaching a critical inflection point.
From a bullish perspective, the first key confirmation would be a reclaim of the 50-day moving average, currently sitting near $0.7983. A sustained move above this level would signal weakening bearish momentum and growing buyer confidence.
Beyond that, the major level to watch lies at the neckline resistance near $1.4066. A clean breakout above this zone could shift ASTER into a broader recovery phase, potentially mirroring the type of upside expansion HYPE experienced once its reversal was confirmed.
Adding to the constructive backdrop, Aster activated its Strategic Buyback Reserve today. The protocol is now automatically repurchasing $ASTER using 20–40% of daily platform fees, expanding its Stage 5 buyback program launched in December 2025. These buybacks are on-chain verifiable, dynamically adjusted based on market conditions, and designed to gradually reduce circulating supply. Notably, early buyback activity is already visible on-chain, and the timing coincides with ASTER printing fresh lows — a move widely viewed as a stabilization effort.
Key Risk Note
While fractal similarities can provide valuable context, they are not guarantees. Market conditions, liquidity profiles, and sentiment can vary significantly between assets and cycles. ASTER still needs confirmation through moving average reclaims and follow-through buying. A failure to hold current support zones would weaken the bottoming thesis and open the door to further downside.
Bottom Line
ASTER appears to be approaching a make-or-break zone. The emerging rounding bottom, historical fractal similarity to HYPE, and the launch of an active buyback mechanism all point toward a potential shift in momentum. Whether this structure evolves into a confirmed bottom or turns into another pause before continuation lower will depend on how price reacts around the 50-day moving average and key resistance levels in the days ahead.
Disclaimer: The views and analysis presented in this article are for informational purposes only and reflect the author’s perspective, not financial advice. Technical patterns and indicators discussed are subject to market volatility and may or may not yield the anticipated results. Investors are advised to exercise caution, conduct independent research, and make decisions aligned with their individual risk tolerance.
About Author: Nilesh Hembade is the Founder and Lead Author of Coinsprobe, with over 5 years of experience in the cryptocurrency and blockchain industry. Since launching Coinsprobe in 2023, he has been providing daily, research-driven insights through in-depth market analysis, on-chain data, and technical research.
Disclaimer: The information on this page may come from third parties and does not represent the views or opinions of Gate. The content displayed on this page is for reference only and does not constitute any financial, investment, or legal advice. Gate does not guarantee the accuracy or completeness of the information and shall not be liable for any losses arising from the use of this information. Virtual asset investments carry high risks and are subject to significant price volatility. You may lose all of your invested principal. Please fully understand the relevant risks and make prudent decisions based on your own financial situation and risk tolerance. For details, please refer to
Disclaimer.
Related Articles
Deutsche Bank Survey Shows US Bitcoin Adoption Rose to 12% in March, Up from 7% in February
Gate News message, April 21 — An investor survey by German banking giant Deutsche Bank revealed that cryptocurrency adoption in the US rose to 12% in March, up from a low of 7% in February, returning to levels projected for July 2025.
The report highlighted recovery in institutional demand as a
GateNews34m ago
Altcoins Surge Back Above $1.3T as Markets Rally After Greenland Crisis Resolution
On January 22, altcoins rebounded nearly 10% to $1.39 trillion due to eased global tensions, with Ethereum leading gains. Despite some volatility, the combined market cap stabilized at $1.32 trillion as other altcoins also showed modest recovery.
Coinpedia1h ago
ARB Recovery Gains Steam as Staking Yields Jump Above 221%
ARB rebounded 10% with strong volume and improving bullish market structure.
Staking yields rose above 221%, attracting more yield-focused investor interest.
Resistance near $0.14 remains key, with liquidity risks below current price.
Arbitrum — ARB, is showing renewed strength after a s
CryptoNewsLand1h ago
ETH and Altcoins Could See Parabolic Surge Upon Following Bullish Russell 2000 ATH Path
ETH and altcoins coils see parabolic surge upon following a bullish indicators.
The Russell 2000 just set a new ATH at 2,798 for the first time.
This new ATH indicator is a bullish signal for altcoins.
The crypto community is pleased to see that both BTC and ETH are trading at higher
CryptoNewsLand4h ago
Bitcoin Tops $75K as Ceasefire Hopes Drive Rally
Bitcoin rose on ETF demand while miners sold BTC; margins tightened and AI/HPC-focused pivots could turn miners into AI data-center players, potentially boosting valuations as AI demand grows.
Abstract: Bitcoin rose on ETF demand amid miner selling and tight margins. The report highlights a strategic pivot by public miners toward AI/HPC infrastructure, signaling a potential shift from pure bitcoin mining to AI data-center services and higher valuation multiples.
CryptoFrontier4h ago
Shiba Inu Sees 82.5B Token Outflow as Market Structure Shifts
Key Insights
Shiba Inu saw 82.5 billion tokens exit exchanges within 24 hours, signaling reduced supply pressure and increasing accumulation behavior among larger holders.
Exchange net flows remain positive as inflows persist, yet rising outflows suggest a gradual balance forming between
CryptoNewsLand4h ago
