Zcash (ZEC) Holds Key Support — Can Bulls Trigger a Bounce Toward $411?

Key Takeaways
-
ZEC is holding a major support zone between $300–$335 after a 30% monthly correction.
-
A descending triangle pattern is forming on the daily chart.
-
A breakout above $411 could signal the start of a renewed bullish move.
Zcash (ZEC) is showing early signs of stabilization after a sharp corrective phase. As of January 26, 2026, ZEC is trading near the $360 level, posting a 4% gain over the past 24 hours. This bounce comes after a steep 30% decline over the last month, which followed ZEC’s explosive 2025 rally, where the privacy-focused cryptocurrency surged more than 800% at its peak, reaching levels near $750.
While broader market conditions remain volatile, ZEC’s latest price action suggests that the asset may be approaching a decisive moment — one that could determine whether bulls regain control or bears extend the correction.
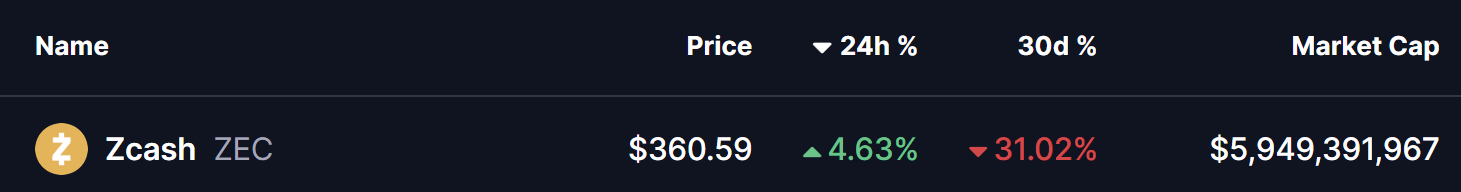
Source: Coinmarketcap
Descending Triangle Takes Shape on the Daily Chart
From a technical perspective, Zcash’s daily chart reveals a well-defined descending triangle pattern, a structure that typically forms after a strong uptrend and often precedes a major directional move.
This pattern is characterized by two key elements:
-
A horizontal support zone between $300 and $335, which has consistently attracted buyers during recent pullbacks.
-
A sequence of lower highs, creating a downward-sloping resistance line originating from the 2025 peak near $750.
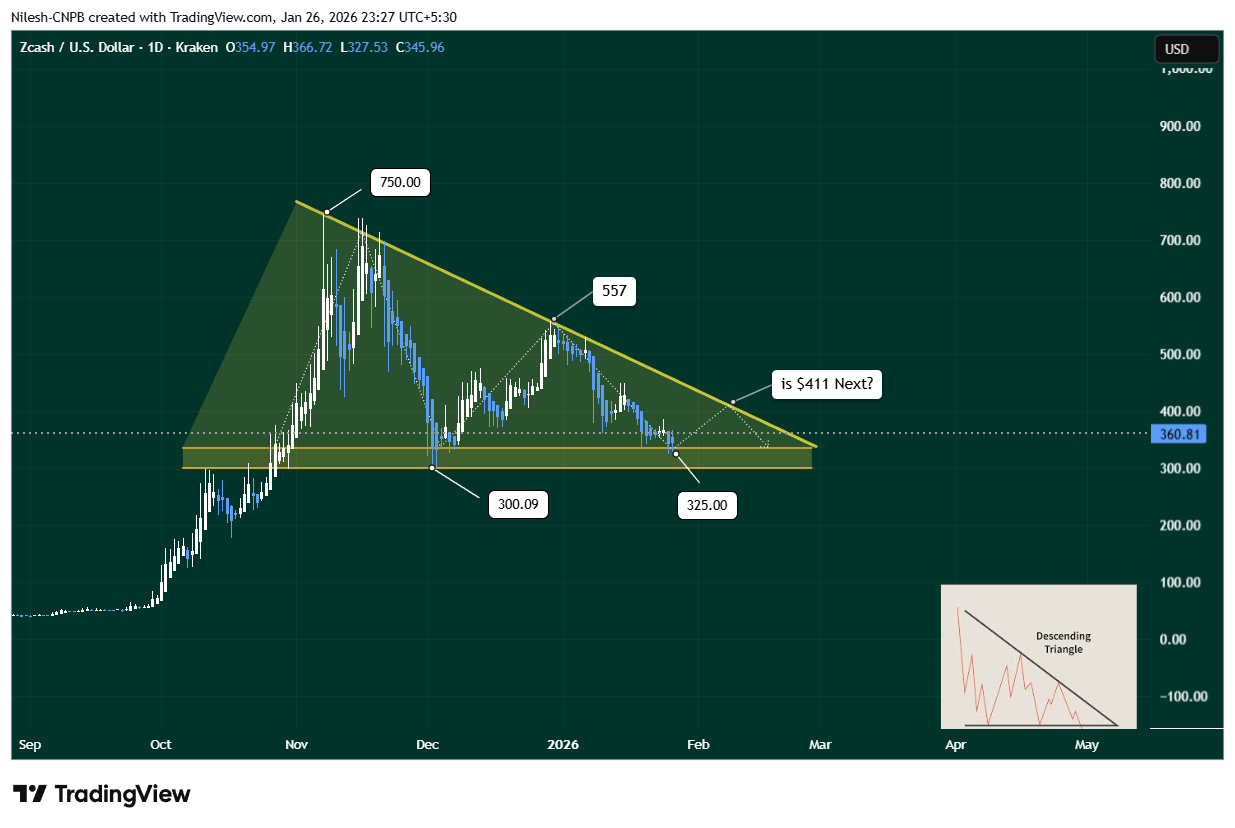
Zcash (ZEC) Daily Chart/Coinsprobe (Source: Tradingview)
During the most recent leg of the correction, ZEC dipped into the lower boundary of this support zone, finding demand near $325. Buyers stepped in aggressively at this level, triggering a rebound that lifted price back toward the $360 area. This reaction suggests that bulls are actively defending the structure and are not yet willing to concede control.
The repeated defense of the $300–$335 region highlights its importance as a critical accumulation zone. As long as ZEC continues to trade above this range, the broader technical structure remains intact.
What’s Next for ZEC?
Looking ahead, If ZEC continues to sustain above the support trendline, the next logical move would be a retest of the descending resistance near $411.
-
Bullish Scenario:
If ZEC holds above support and breaks above the $411 resistance with strong volume, it could invalidate the bearish implications of the descending triangle and mark the beginning of a new bullish expansion phase. -
Bearish Scenario:
Failure to break resistance — or a loss of the $300–$335 support zone — could send ZEC back into consolidation or trigger another retest of lower demand levels before a clear trend emerges.
Final Outlook
Zcash is currently at a technical inflection point. The combination of strong historical support, a tightening price structure, and an early rebound off key demand levels suggests that a larger move may be approaching. Whether that move resolves higher toward $411 or lower back into support will depend on how price reacts as the descending triangle nears its apex.
For now, $325 support and $411 resistance remain the two most important levels to monitor.
Disclaimer: The views and analysis presented in this article are for informational purposes only and reflect the author’s perspective, not financial advice. Technical patterns and indicators discussed are subject to market volatility and may or may not yield the anticipated results. Investors are advised to exercise caution, conduct independent research, and make decisions aligned with their individual risk tolerance.
About Author: Nilesh Hembade is the Founder and Lead Author of Coinsprobe, with over 5 years of experience in the cryptocurrency and blockchain industry. Since launching Coinsprobe in 2023, he has been providing daily, research-driven insights through in-depth market analysis, on-chain data, and technical research.
Related Articles
Dogecoin breaks through key resistance to turn it into support: DOGE price gains strength and may challenge the $0.096 level
MICA Daily|Bitcoin CVD indicates increasing spot selling pressure, and the price may challenge $60,000 again
Cosmos (ATOM) To Rise Higher? Key Pattern Signals Potential Upside Move
Bitcoin rebounds back to $65,000: Weakening dollar + double bottom pattern battle, is it a 10% rise or a 25% drop at the critical point?
When "stability" begins to fluctuate: A full review and structural analysis of the USD1 de-pegging event
Altcoins Up 10–20% as Breakout Hype Builds—Is a 50% Rally Next or Too Risky to Chase?