Glassnode: Bitcoin falls below the true average, market enters "bearish period"
Bitcoin breaks below a key support level, spot trading volume remains sluggish, and investor losses are prompting more selling. Futures markets are experiencing forced deleveraging, institutional fund inflows have significantly weakened, and the market has entered a defensive stance. This article is based on an analysis by Glassnode, compiled and written by Foresight News.
(Previous summary: Bitcoin drops below $70,000! Returns to November 2024 levels, fully retracing gains from Trump’s term)
(Additional background: Arthur Hayes warns of more black swans for Bitcoin: today’s BTC trend looks concerning)
Table of Contents
- Core Insights
- On-Chain Data Observations
- Breaking key support
- Potential demand zones analysis
- Market pressure indicators
- Comparison with historical cycles
- Market Dynamics
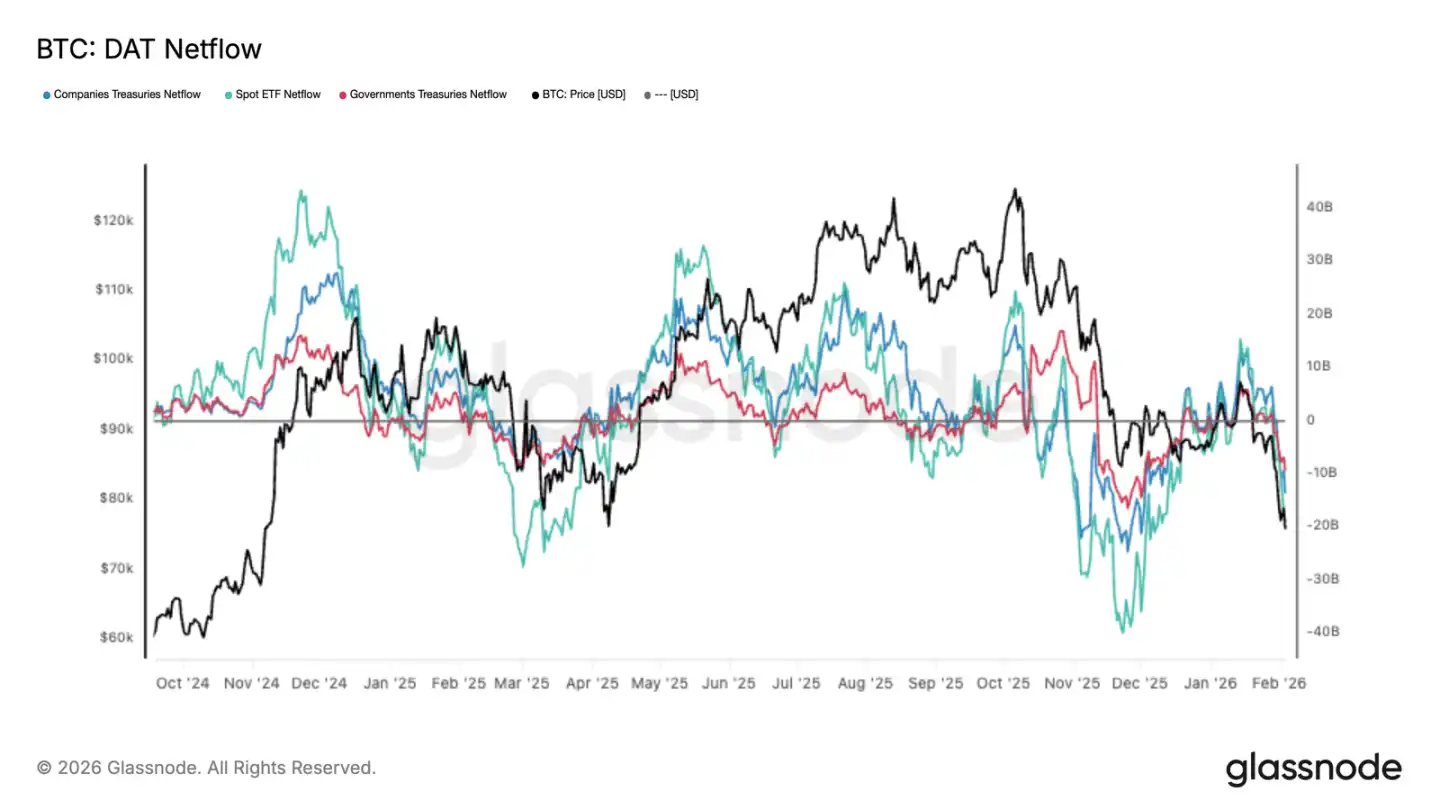
- Institutional funds turning net outflows
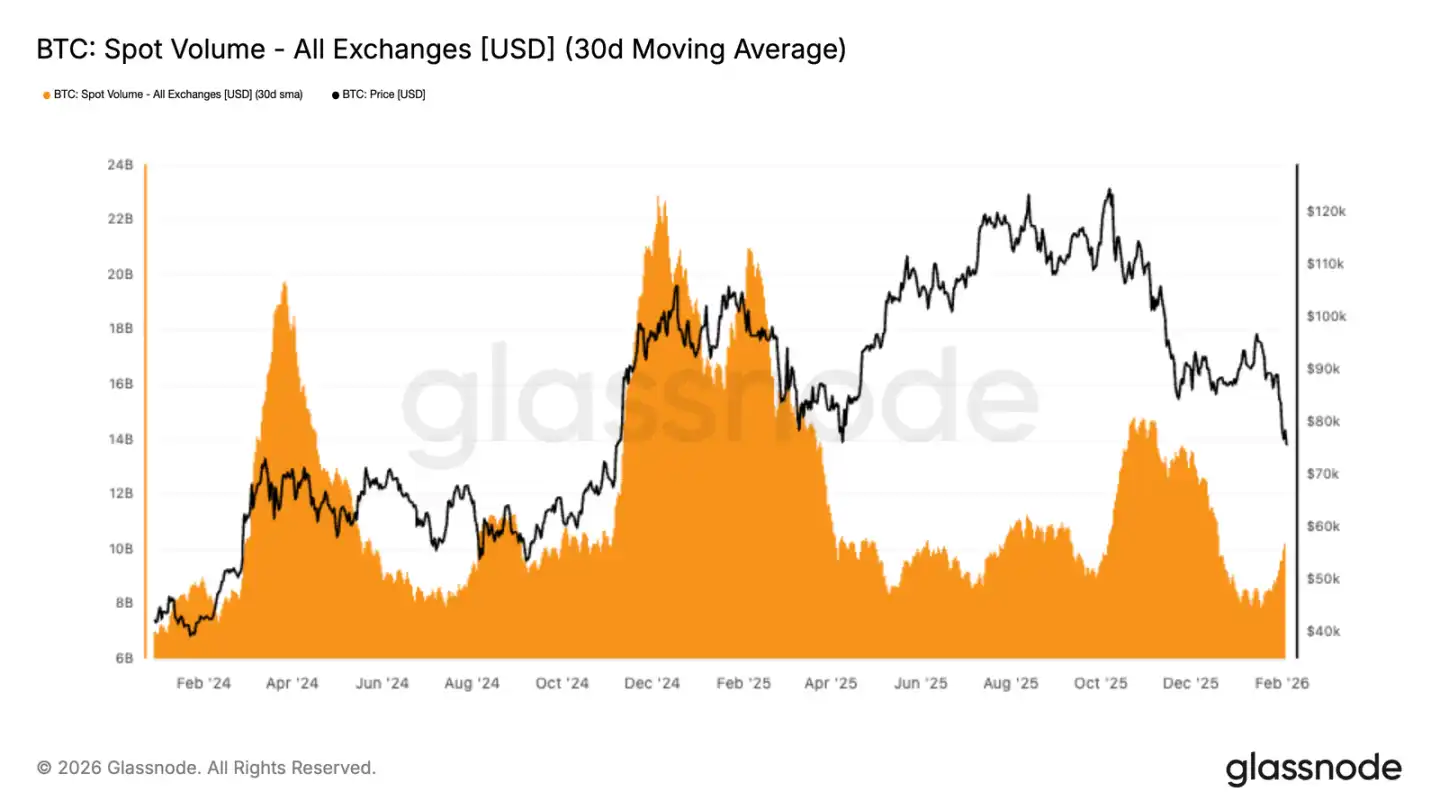
- Spot trading volume remains muted
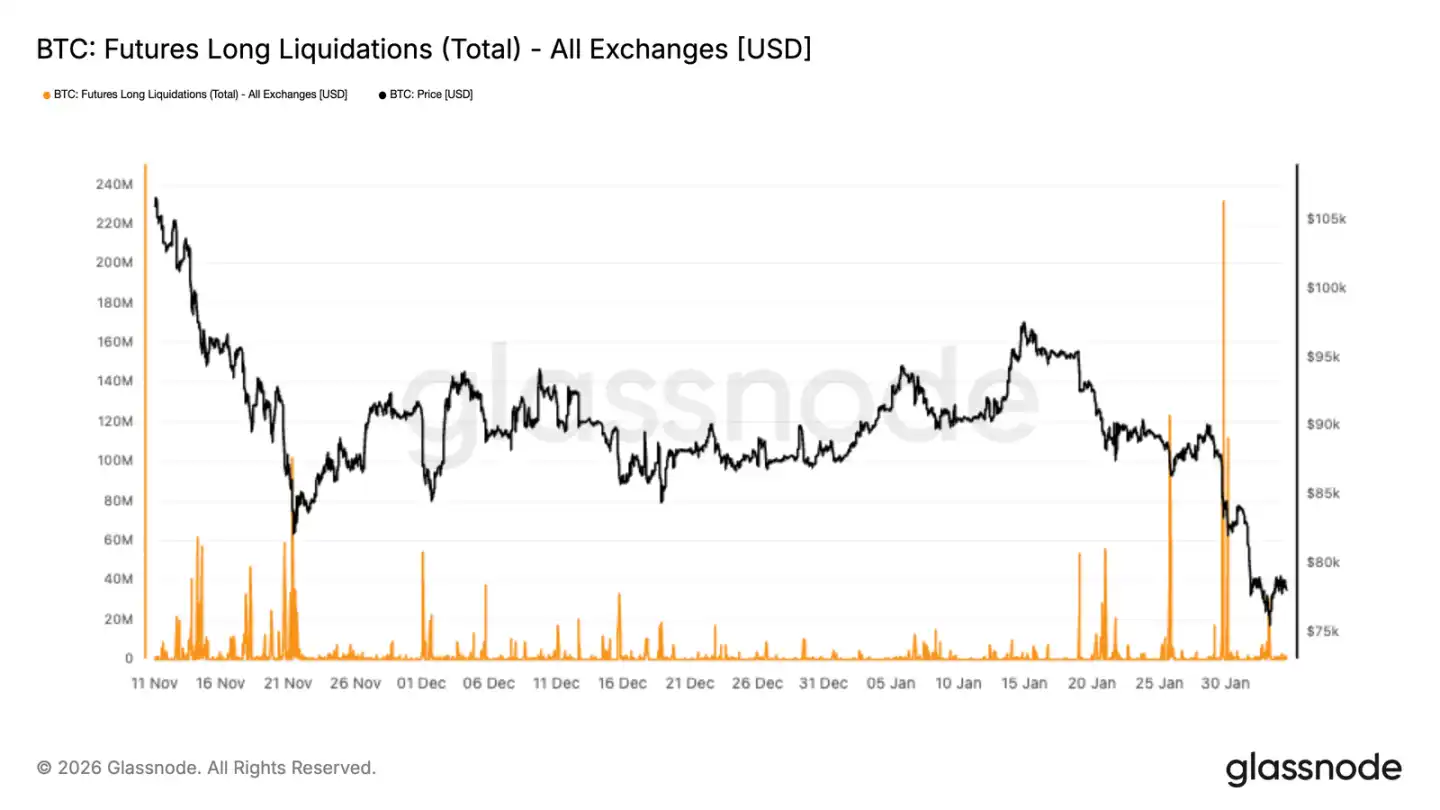
- Futures market forced liquidations
- Short-term volatility remains high
- Increasing demand for put options
- Volatility risk premium turns negative
- Changes in $75,000 put option premiums
- Summary
Spot trading volume continues to be weak. Despite the price falling from $98,000 to $72,000, the 30-day average trading volume remains subdued. This reflects insufficient market demand and a lack of effective absorption of selling pressure.
Core Insights
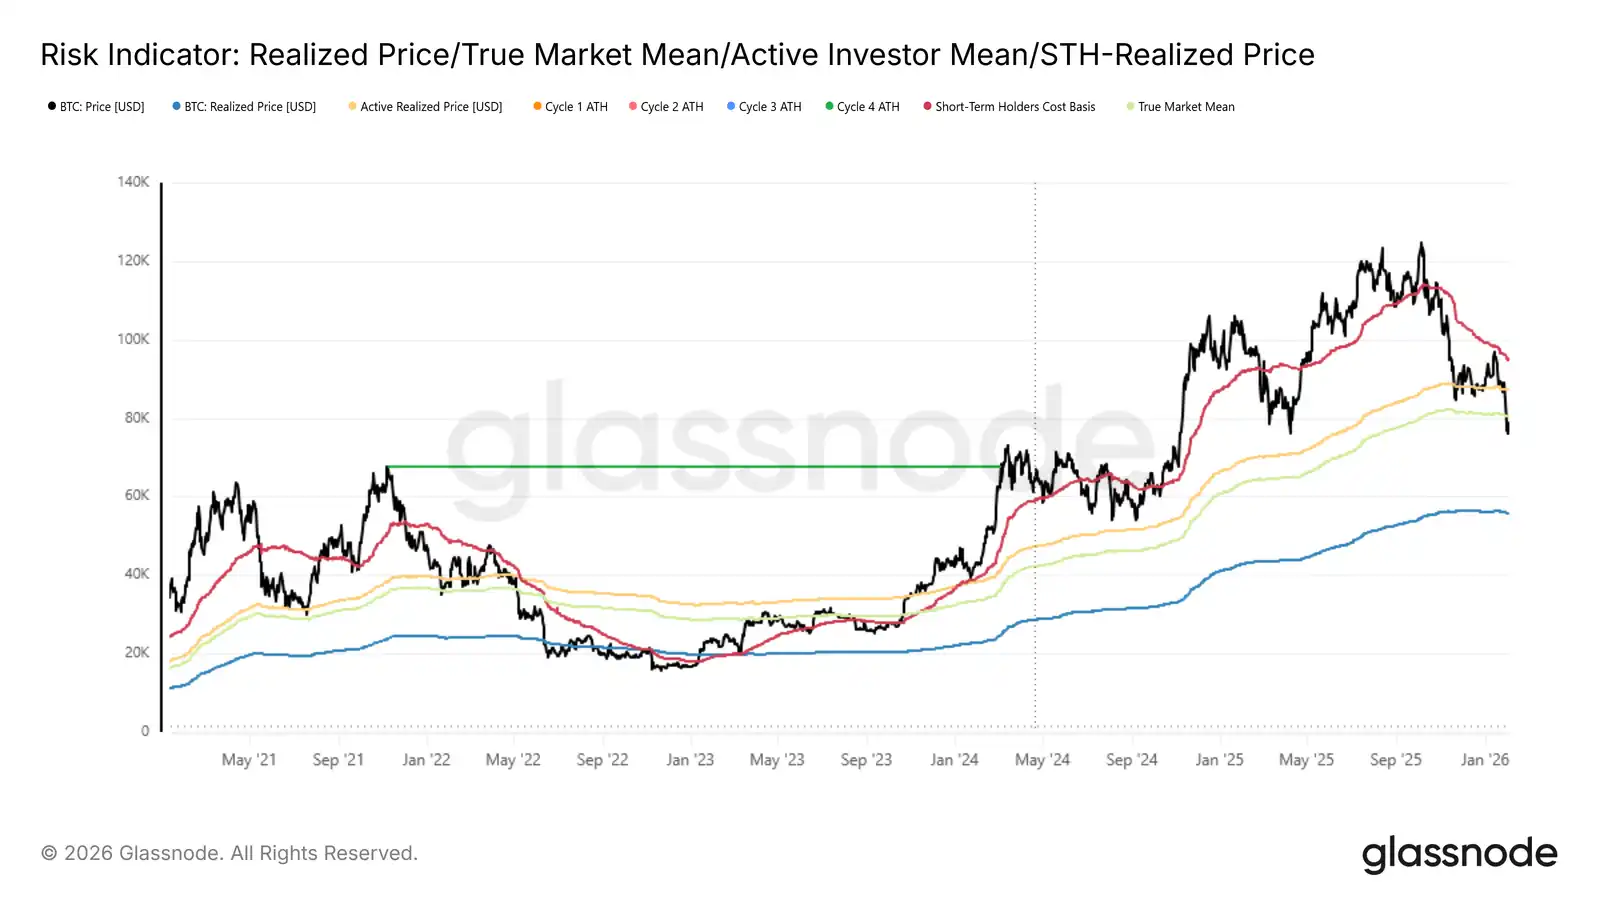
· Bitcoin has confirmed a breakdown, with the price falling below the true market mean, shifting market sentiment to cautious defense.
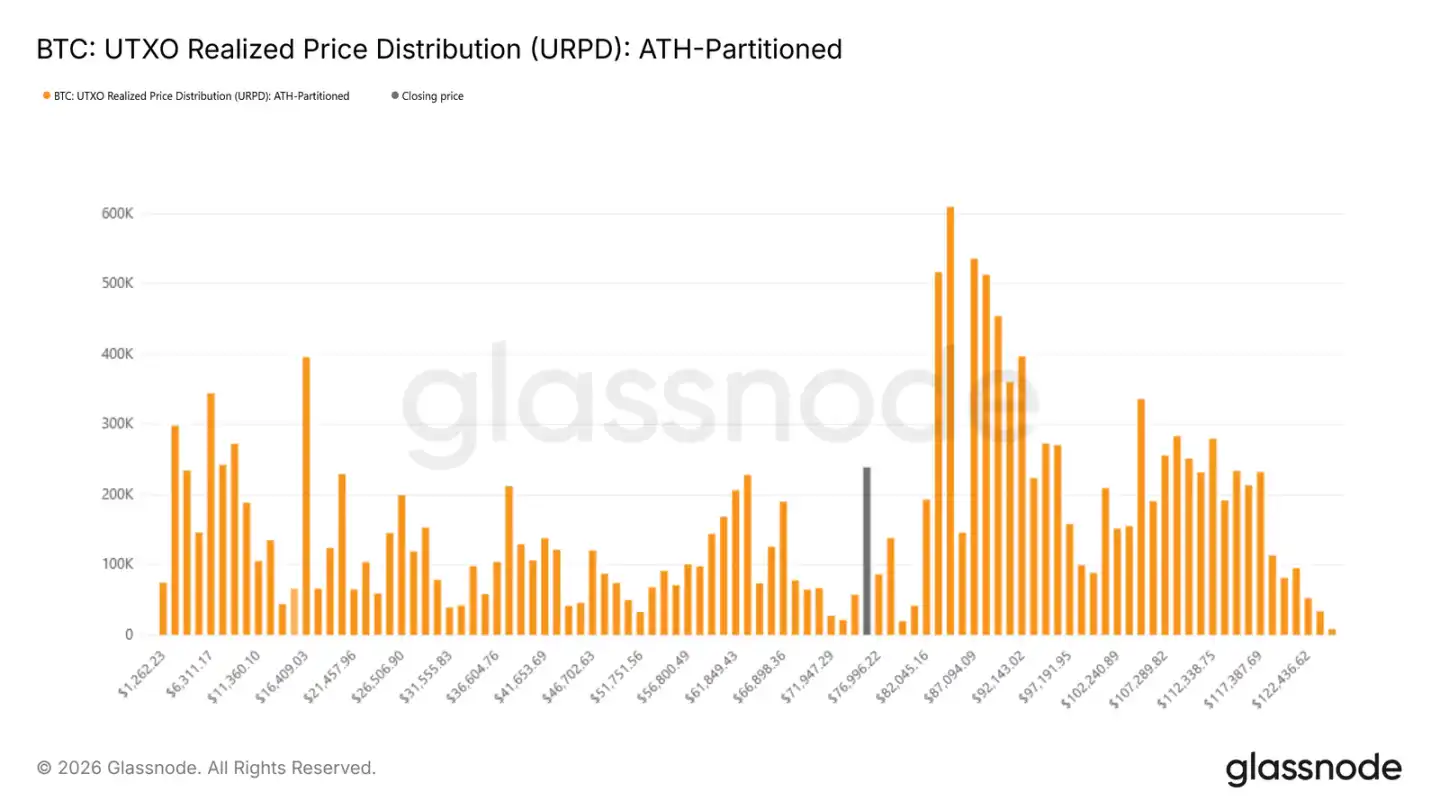
· On-chain data shows initial signs of accumulation in the $70,000 to $80,000 range, with a dense cost basis zone between $66,900 and $70,600, which may serve as a short-term buffer against further declines.
· Investor losses are intensifying as more holders are forced to sell at a loss during the ongoing downtrend.
· Spot trading volume remains weak, further indicating limited market absorption and a lack of buying interest.
· Futures markets are undergoing forced deleveraging, with large-scale long liquidations exacerbating volatility and downward pressure.
· Institutional inflows have significantly diminished; ETF and related fund inflows have shrunk, unable to provide sustained buying support like during previous rallies.
· The options market continues to reflect high downside risk expectations, with implied volatility remaining elevated. Rising demand for puts indicates strong hedging sentiment.
· With leverage being unwound and spot demand still weak, prices remain fragile. Any rebounds may be technical corrections rather than trend reversals.
On-Chain Data Observations
Following last week’s analysis indicating risk of downside after failing to recover the short-term cost basis at $94,500, the price has now clearly broken below the true market mean.
Breaking Key Support
The true market mean (average cost of active circulating holdings excluding long-term dormant tokens) has repeatedly served as a critical support level during this correction.
The breach confirms a deterioration in market structure since late November, resembling the transition from consolidation to deep correction seen in early 2022. Weak demand combined with persistent selling pressure indicates a fragile equilibrium.
In the medium term, price volatility is narrowing. Resistance is around the true market mean near $80,200, while support lies near the realized price around $55,800, a level historically attracting long-term investors.
Potential Demand Zones Analysis
As the market structure resets, focus shifts to possible stabilization points on the downside. Several on-chain indicators help identify potential bottoming zones:
UTXO realized price distribution shows significant accumulation by new investors between $70,000 and $80,000, indicating willingness to buy on dips in this range. Below that, the dense cluster between $66,900 and $70,600 has historically acted as short-term support.
Market Pressure Indicators
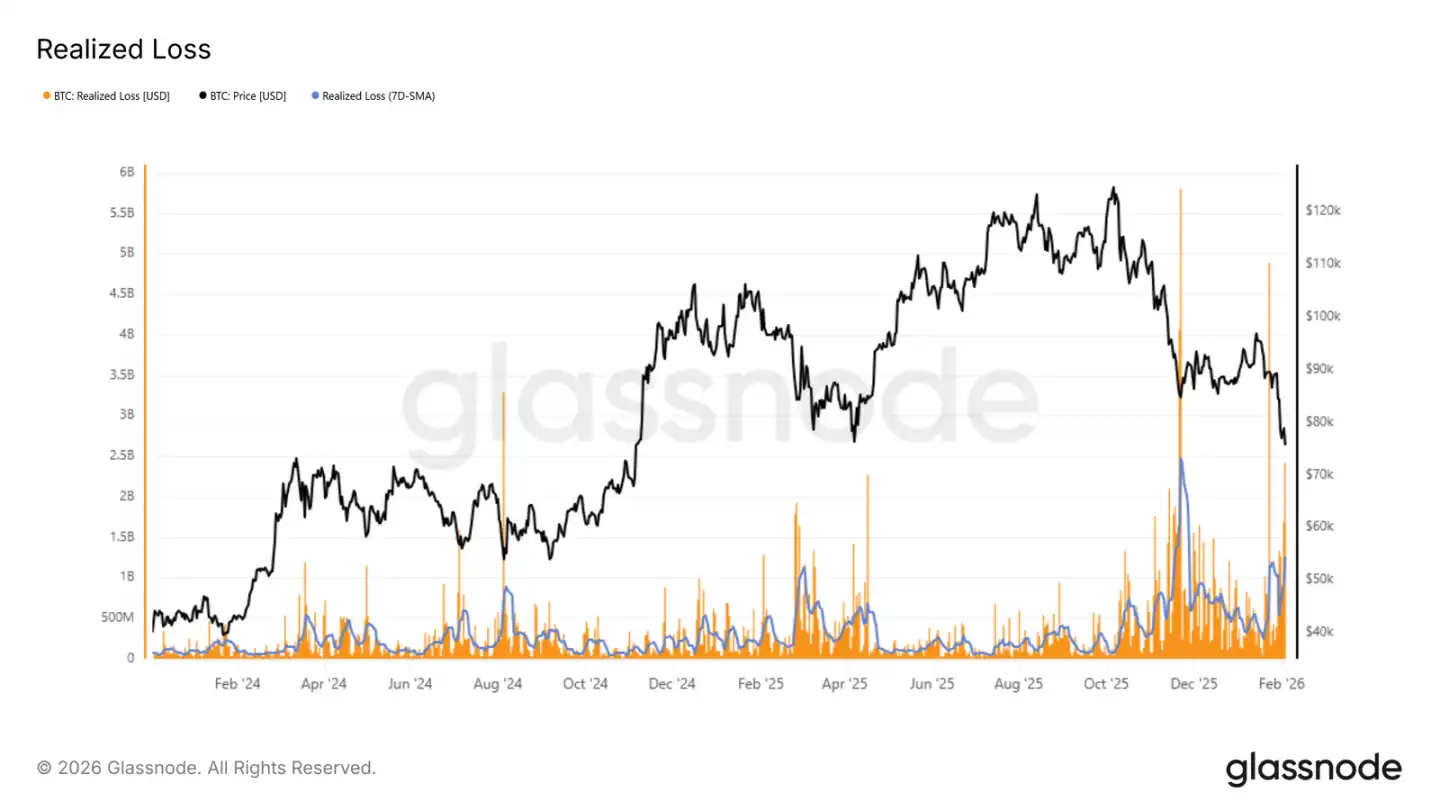
Realized loss metrics directly reflect investor stress levels. Currently, the 7-day average realized loss exceeds $1.26 billion daily, indicating increased panic selling after breaching key support.
Historical data shows peaks in realized losses often occur during capitulation phases. For example, during the recent rebound from $72,000, daily realized losses briefly exceeded $2.4 billion, often signaling short-term turning points.
Comparison with Historical Cycles
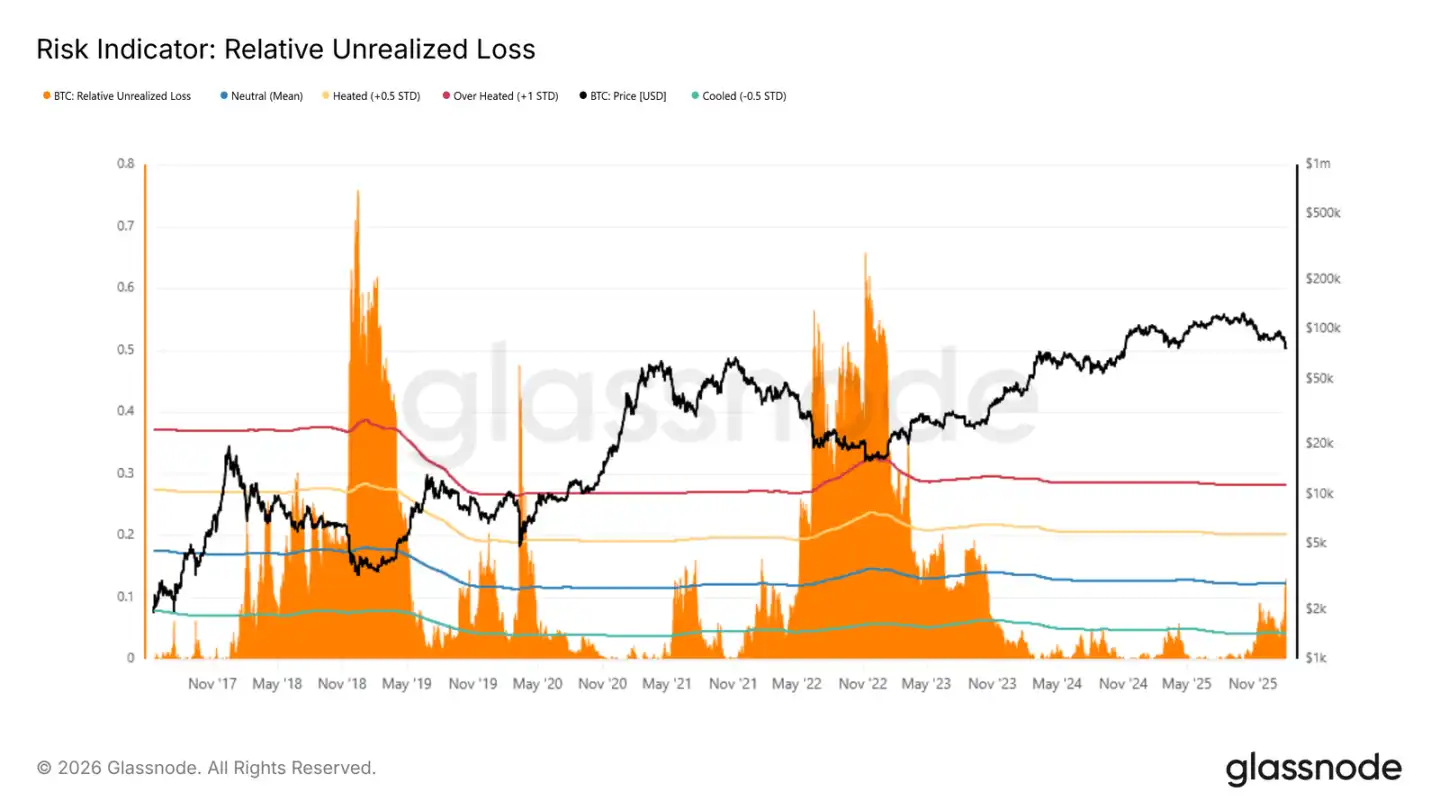
The ratio of unrealized losses to market cap offers a cross-cycle perspective on market stress. Extreme bear market values often surpass 30%, with 2018 and 2022 bottoms reaching 65%-75%.
Currently, this indicator is above the long-term average (~12%), suggesting holders with cost basis above current prices are under pressure. To reach historical extremes, systemic events akin to LUNA or FTX collapses would be necessary.
Market Dynamics
Spot and futures volumes remain low; options markets continue to focus on downside protection.
Institutional Funds Turning Net Outflows
As prices decline, demand from major institutional investors weakens. Spot ETF inflows slow, corporate and government-related funds decrease, indicating reduced willingness for incremental investments.
This contrasts sharply with previous upward phases supported by continuous capital inflows. The shift in fund flow further confirms a lack of new capital entering at current levels.
Spot Trading Volume Still Dull
Despite the drop from $98,000 to $72,000, the 30-day average trading volume has not significantly increased. This suggests a lack of sufficient buy-side activity during the decline.
Historically, genuine trend reversals are accompanied by a surge in spot volume. The current modest volume rebound indicates market activity remains focused on de-risking and liquidation rather than new positions.
Limited liquidity makes the market more sensitive to sell pressure; even moderate sell orders can trigger larger drops.
Futures Market Forced Liquidations
Massive long liquidations have occurred, reaching the highest levels since this decline began. This indicates that as prices fell, leveraged long positions were forcibly closed, intensifying downward momentum.
Notably, during November-December, liquidation activity was relatively moderate, suggesting leverage was gradually rebuilding. The recent spike marks a shift into a phase of forced deleveraging, with liquidations being a primary driver of price declines.
Whether prices can stabilize depends on the extent of deleveraging. Genuine recovery requires spot buying interest; mere liquidation cannot sustain a rebound.
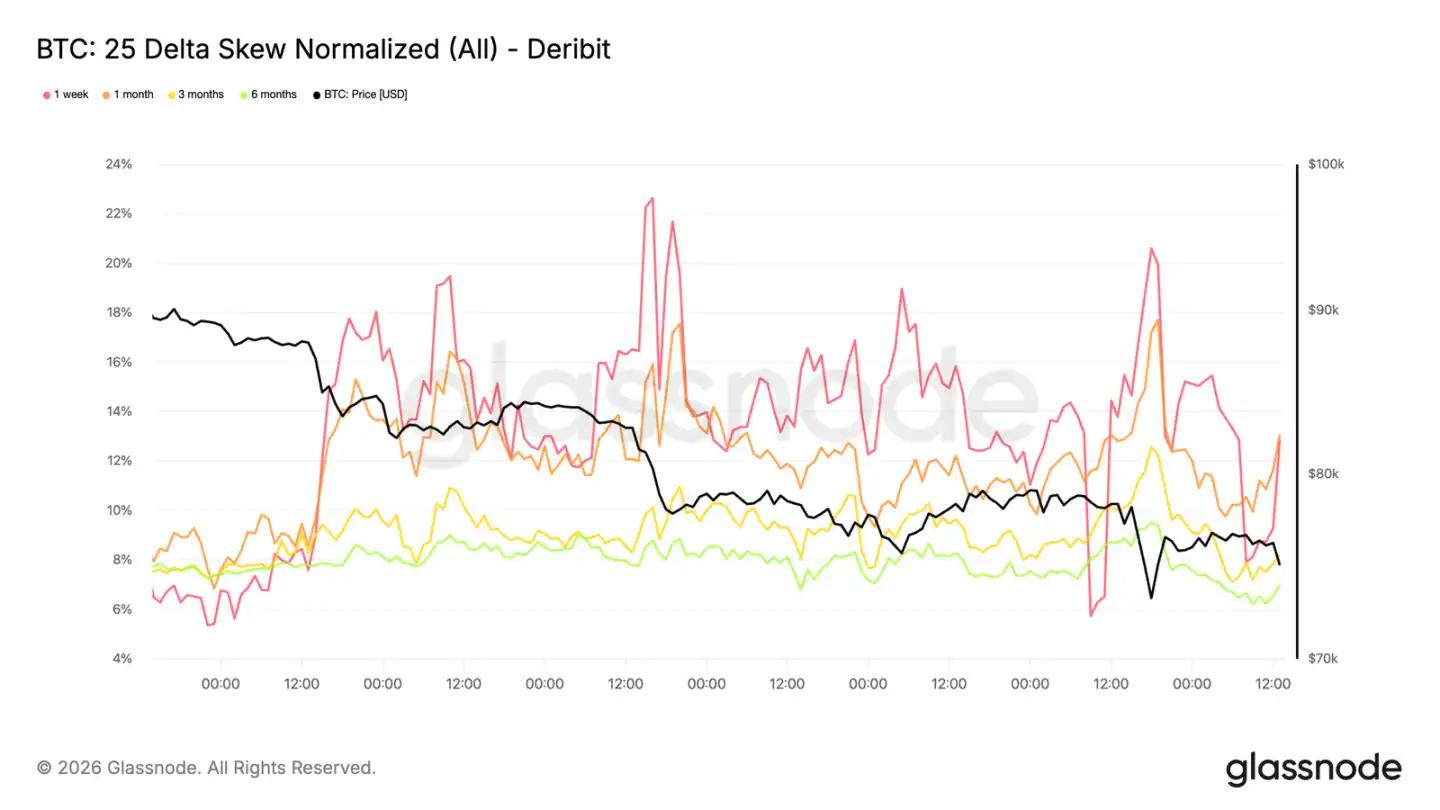
Short-term Volatility Remains Elevated
When prices tested the previous high near $73,000 (now acting as support), implied volatility surged to around 70%. Over the past week, volatility levels increased by about 20 points compared to two weeks prior, with the entire volatility curve shifting upward.
Short-term implied volatility remains above recent realized volatility, indicating traders are willing to pay premiums for short-term protection. This re-pricing is especially evident in recent contracts, highlighting risk aversion.
This more reflects hedging against sudden drops rather than directional bets. Traders are reluctant to sell large amounts of short-term options, keeping downside protection costs high.
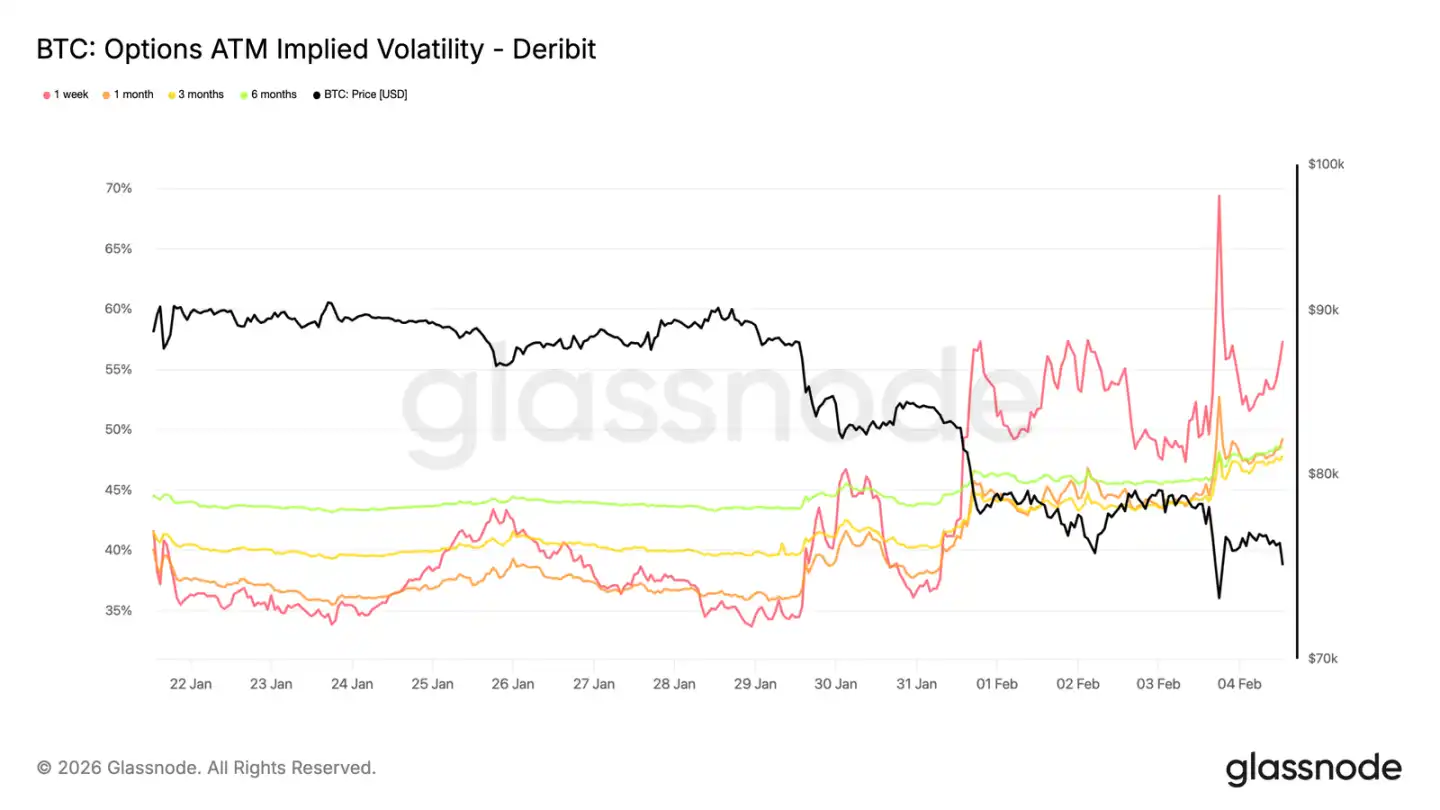
Increasing Demand for Puts
Volatility re-pricing shows a clear directional bias. The skew between puts and calls has widened again, with puts becoming more expensive relative to calls, signaling heightened concern over downside risk rather than upside potential.
Even with prices above $73,000, options flows remain concentrated on protective positions, pushing implied volatility distribution toward the negative side and reinforcing a defensive market tone.
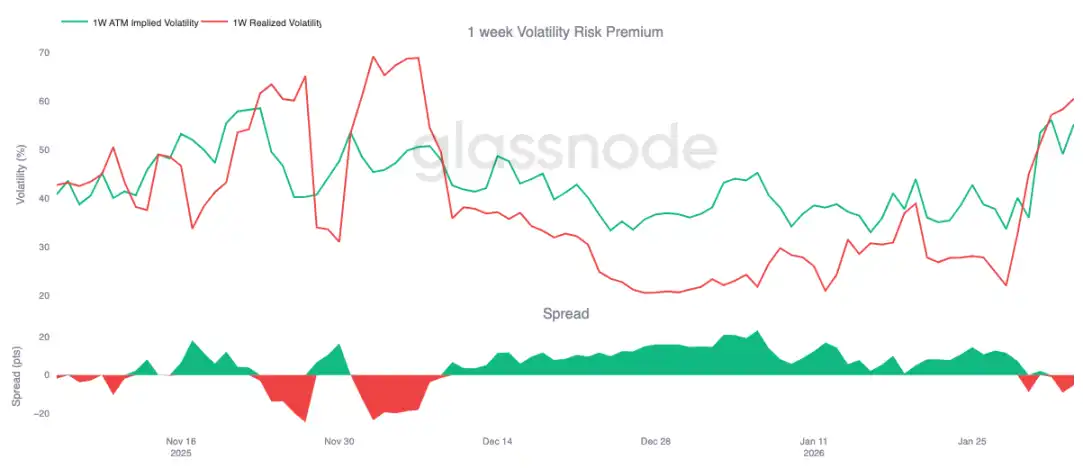
Volatility Risk Premium Turns Negative
One-week volatility risk premium turned negative for the first time since early December, now around -5, compared to +23 a month ago.
A negative risk premium indicates implied volatility is below actual realized volatility. For option sellers, this means time decay is now a drag rather than a benefit, prompting more frequent hedging and adding short-term market stress.
In this environment, options no longer stabilize the market; instead, they may amplify volatility.
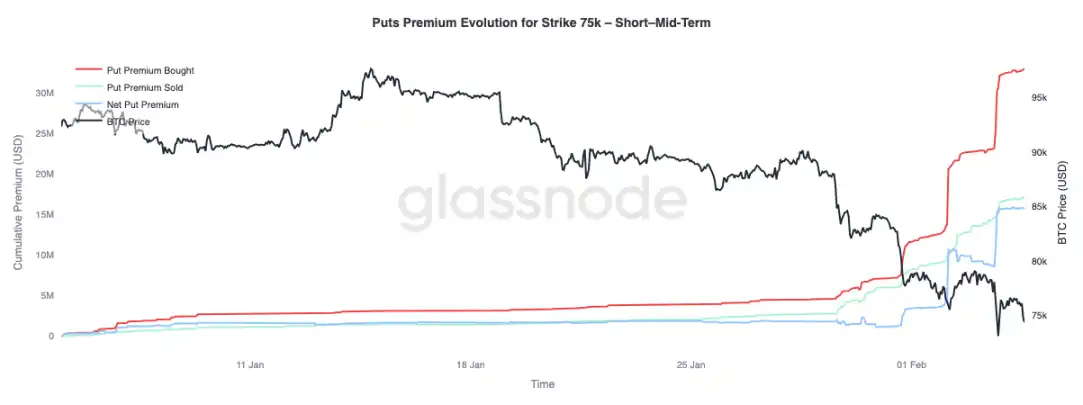
Changes in $75,000 Put Option Premiums
The $75,000 strike puts have become a focal point, repeatedly tested. Net buying of puts has increased significantly, progressing in three phases, each aligned with price declines lacking meaningful rebounds.
For longer-term options (over 3 months), the situation differs: net selling premiums have begun to surpass net buying, indicating traders are willing to sell high-volatility longer-dated options while still paying for short-term protection.
Summary
After failing to reclaim the critical $94,500 level, Bitcoin broke below the true market mean at $80,200, entering a defensive phase. As the price drops into the $70,000 range, unrealized gains shrink, and realized losses increase. While initial accumulation signs appear between $70,000 and $80,000, a dense zone of holdings between $66,900 and $70,600 persists, but ongoing loss-driven selling keeps market sentiment cautious.
In derivatives, selling pressure appears disorderly, with large-scale long liquidations confirming leverage unwinding. While this helps clear speculative excess, it alone does not establish a solid bottom. The options market reflects rising uncertainty, with increased demand for puts and elevated volatility indicating investors prepare for continued turbulence.
The key to future direction remains in spot demand. Without increased spot participation and sustained capital inflows, the market may continue downward, and rebounds could lack durability. Until fundamentals improve, risks remain skewed to the downside. A genuine recovery will require time, thorough capitulation, and renewed buyer confidence.

Related Articles
Ex-LAPD Officer Found Guilty of $350K ‘Wrench Attack’ Bitcoin Robbery
Core Scientific Plans to Sell Nearly All 2,500 BTC in Q1 2026: Here’s Why