Pump.fun (PUMP) faces downward pressure as 10 billion tokens are unlocked, with weak retail buying demand
Pump.fun (PUMP) continues to face correction pressure, declining about 2% at the time of writing on Tuesday, extending the previous session’s 4% plunge. The token of this launchpad platform remains at risk of deeper decline, as 10 billion PUMP are scheduled to be unlocked today, increasing supply pressure amid waning retail investor interest. From a technical perspective, PUMP’s outlook continues to lean toward a negative scenario, with selling pressure clearly dominant and bearish momentum still prevailing in the market.
Monthly token unlocks and weak demand increase downside risk
Data from DeFiLlama indicates that approximately 10 billion PUMP tokens will be unlocked on Tuesday evening and distributed to the community fund and ecosystem. With a total value exceeding $20 million, this amount—especially the portion allocated to the community—could add to selling pressure, as investor sentiment has not yet recovered from last week’s sharp market sell-off.
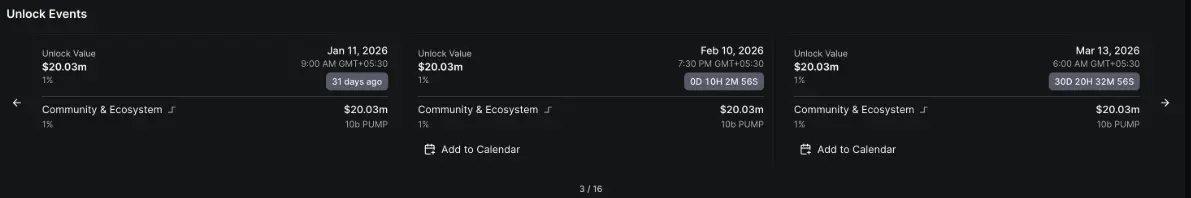 PUMP unlock data | Source: DeFiLlama Conversely, data from CoinGlass shows that the open interest (OI) of PUMP futures contracts has been steadily declining, dropping to $161.95 million on Tuesday. This trend reflects increasing caution and diminishing participation from retail investors.
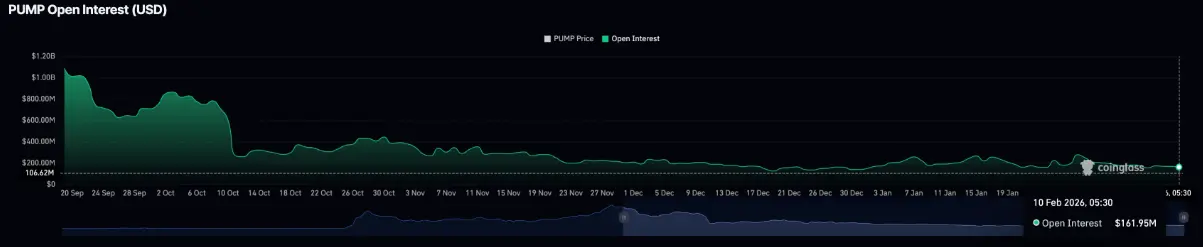 PUMP futures open interest (OI) | Source: CoinGlass
Technical analysis: Will PUMP continue to fall sharply?
PUMP broke below the key psychological level of $0.002000 after a 4% decline on Monday. The selling momentum shows no signs of stopping; as of this writing, the price continued to lose nearly 2% on Tuesday, marking the fourth consecutive day of decline since the peak on February 6 at $0.002201.
The current weakening trend is pushing PUMP close to the support zone at $0.001886—corresponding to the 4-hour candle low formed on February 5. If the price closes clearly below this level on the 4-hour chart, the downtrend is likely to extend, with the next target being the December 29 low around $0.001775.
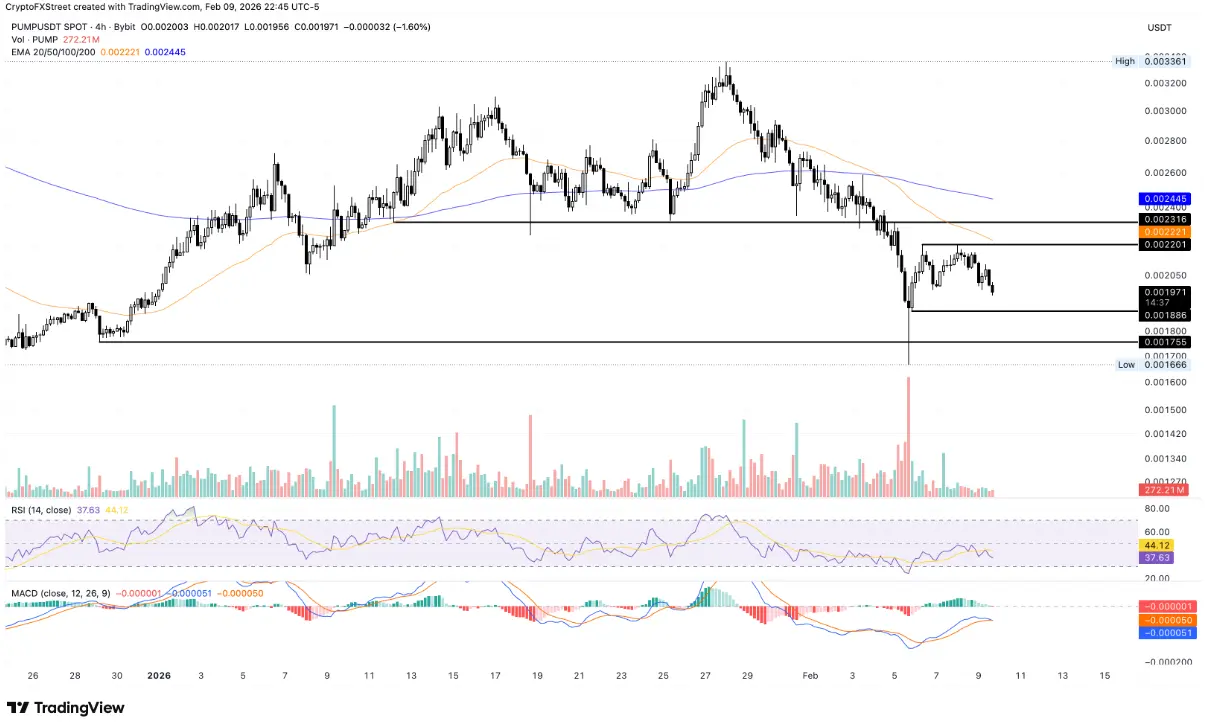 PUMP/USDT 4-hour chart | Source: TradingView
From a technical standpoint, momentum indicators on the 4-hour chart are leaning toward a negative scenario. The RSI has retreated to around 40 and turned downward from the neutral zone, indicating room for correction before entering oversold territory. Meanwhile, the MACD line is approaching the signal line, increasing the risk of a bearish crossover.
Conversely, if the bulls manage to quickly regain the $0.002000 level, the price could recover to test the 50-period EMA at $0.002213, near the short-term high on February 6 at $0.002201.
Related Articles
Breakout Pushes $0.09656 DOGE Above Converging Trendlines as Price Trades Between Key Levels
HBAR Consolidates at $0.095 as Critical $0.094–$0.096 Zone Draws Focus
Will the Pressure Hold? Phala Network Surges 8.6% to $0.02413 as Price Pressures $0.02451 Range Ceiling
Uniswap Price Eyes $4.60 as Fee Burn Vote Advances
Solana Compresses Beneath $90 After Sharp Range Reclaim
3 Promising Crypto Picks That Could Skyrocket in 2026 — SOL, MNT, and LINK