SYRUP maintains momentum as Maple Finance hits $4 billion in assets under management
Maple Finance (SYRUP) is hovering around the $0.2700 USD mark at the time of recording on Friday, as buying pressure persistently protects the S1 Pivot support zone at $0.2497 USD. The steady price maintenance indicates that market sentiment is gradually stabilizing after recent fluctuations.
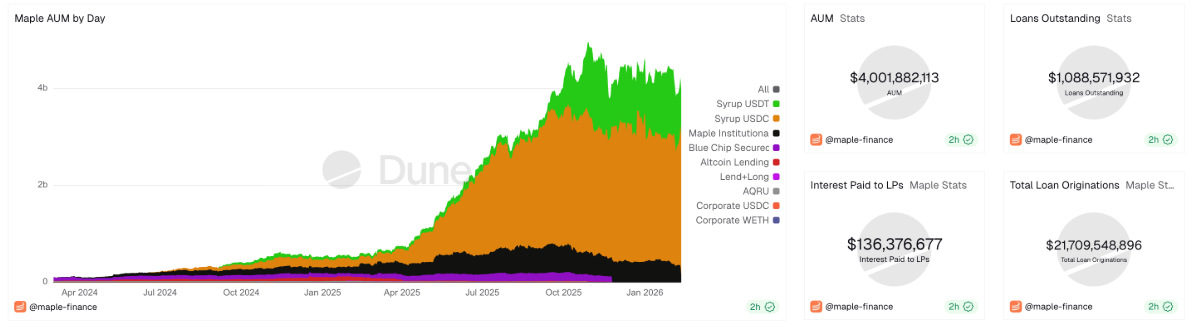
From an on-chain data perspective, demand for this DeFi protocol remains positive. Total Assets Under Management (AUM) has surpassed $4 billion USD, while revenue continues to hold steady after reaching a record high in January — a sign reinforcing investor confidence in the platform.
On the technical side, SYRUP is signaling a potential recovery as selling pressure appears to weaken, opening room for a new upward move if demand continues to be sustained.
Maple Finance Maintains Revenue, Attracts Whales
Data from Dune Analytics dashboards show that Maple Finance has generated $1.46 million USD in revenue so far this month, after hitting a record high of $2.57 million USD — mostly from lending activities and yield optimization strategies. This trend follows steady monthly growth, after the protocol recorded $2.49 million USD in December.
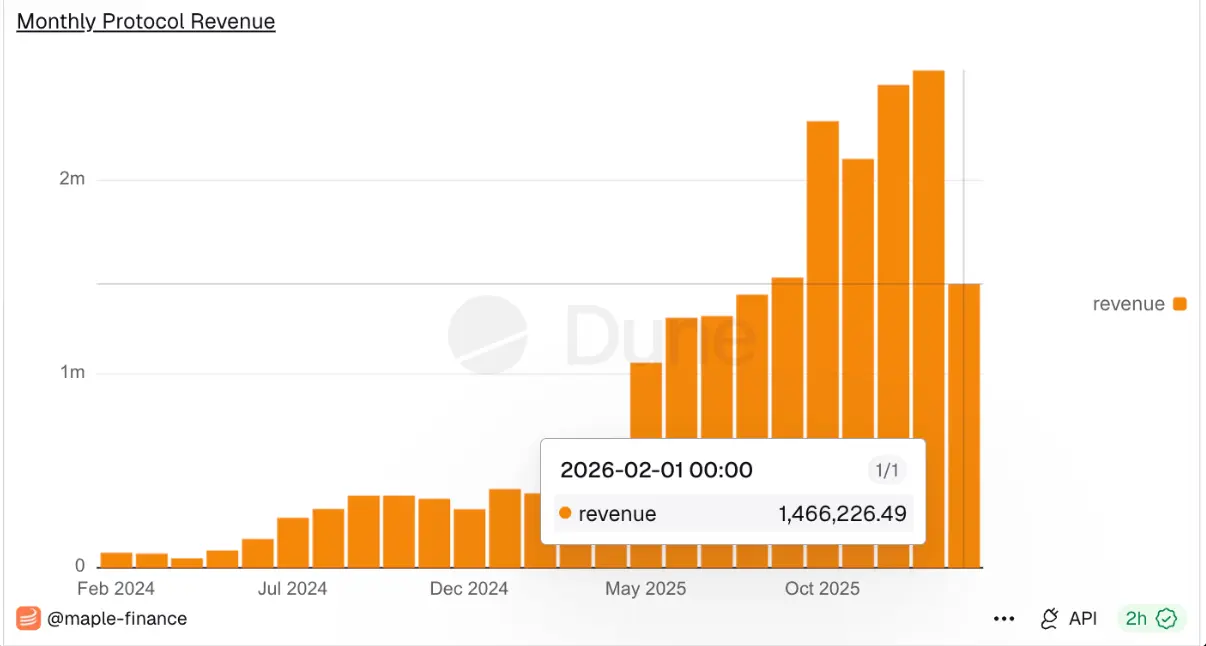 Monthly Revenue of Maple Finance | Source: Dune
Meanwhile, Maple Finance’s total assets under management (AUM) have exceeded $4 billion USD, with lending debt reaching $1.08 billion USD. The combination of stable revenue streams and expanding asset scale indicates that the protocol’s ecosystem is accelerating, benefiting from continuously rising market demand.
Monthly Revenue of Maple Finance | Source: Dune
Meanwhile, Maple Finance’s total assets under management (AUM) have exceeded $4 billion USD, with lending debt reaching $1.08 billion USD. The combination of stable revenue streams and expanding asset scale indicates that the protocol’s ecosystem is accelerating, benefiting from continuously rising market demand.
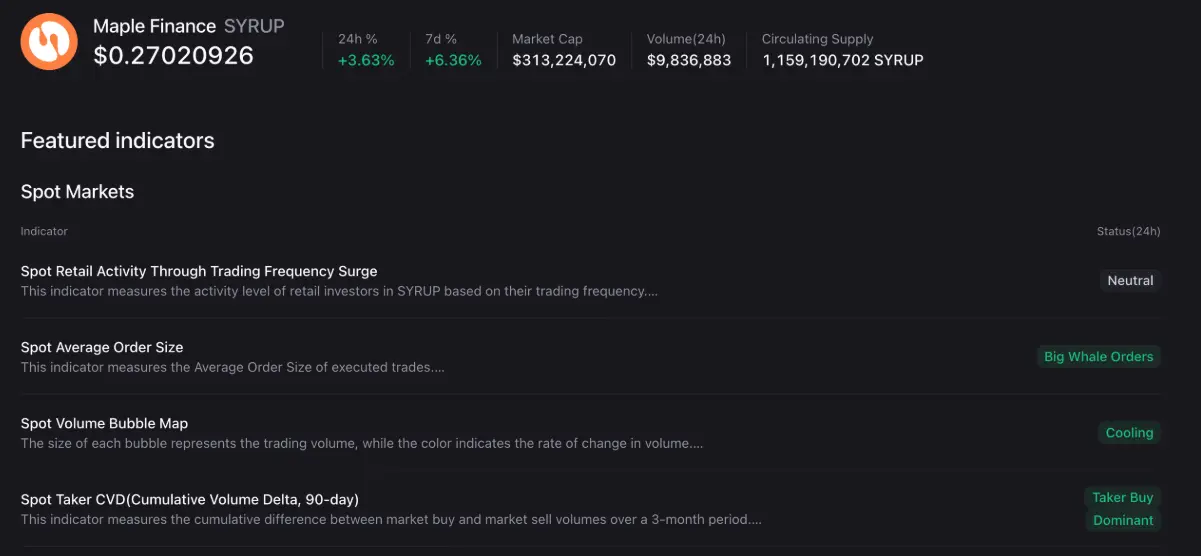 Spot Market Indicators for SYRUP | Source: CryptoQuant
Technical Outlook: Can SYRUP Recover in a Downtrend Channel?
Maple Finance currently trades just above the S1 Pivot level at $0.2497 USD — a short-term support buffer formed after a 31-day decline that saw SYRUP lose about 35% of its value. This movement clearly reflects a downward trajectory within a larger descending channel pattern, established by two parallel trendlines on the daily timeframe.
Conversely, a technical rebound could see SYRUP testing the 50-day Exponential Moving Average (EMA) at $0.3176 USD, before aiming for the 200-day EMA at $0.3666 USD — an area coinciding with the upper boundary of the price channel and serving as a key resistance level.
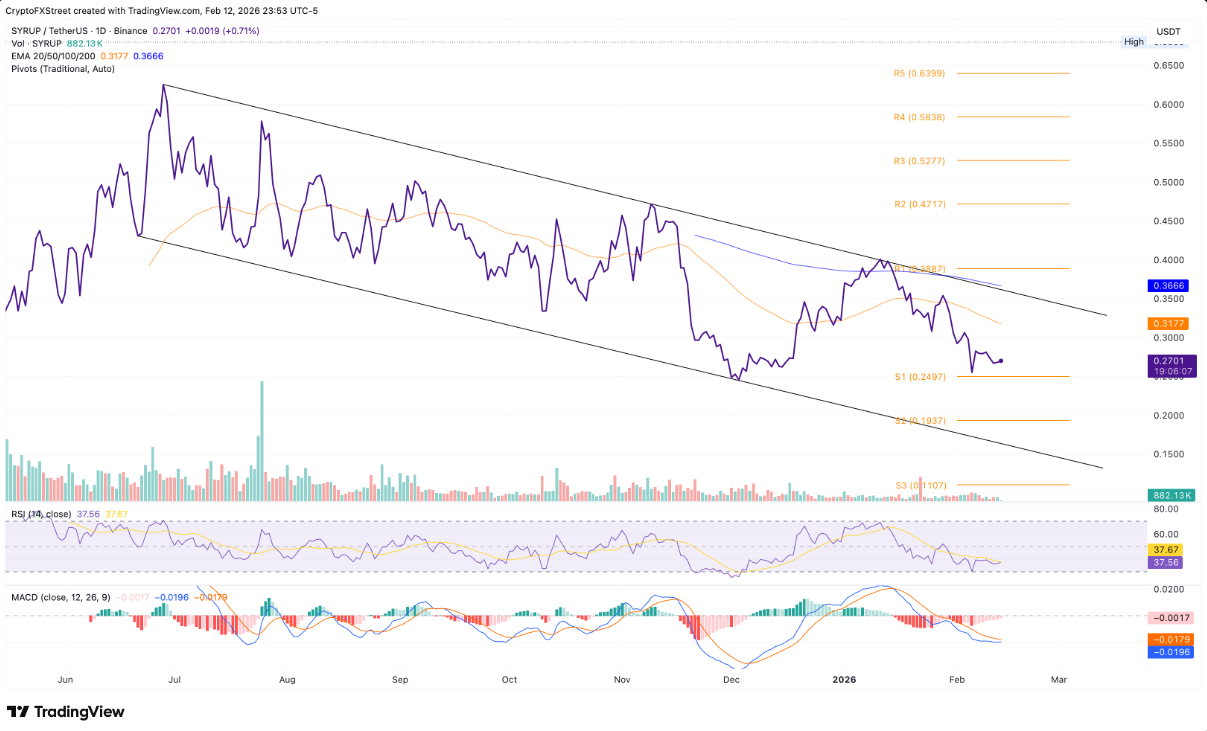
However, a negative scenario should still be considered. If SYRUP closes below the $0.2497 USD level, selling pressure could intensify, pushing the price down toward the S2 Pivot at $0.1937 USD.
Related Articles
Pi Network Rolls Out Phase 2 Protocol Upgrades With Mandatory Node Deadline
LayerZero (ZRO) signals a bottom, opening up expectations for a new bullish phase
Former Credit Suisse CIO: During the CME market closure over the weekend, tokenized gold accounted for "almost 100% price discovery"
Bitcoin and Ethereum March historical returns: with average values of 11.28% and 17.07%, respectively