This weekend, NBA Hall of Famer Scottie Pippen sparked a fresh Bitcoin debate, but veteran chart analyst Peter Brandt attached a price tag to the conversation. In response to Pippen’s comparison of the market structure in 2020 and 2026, Brandt projected a BTC price of $250,000 by 2029 and told the basketball legend to “buy the banana” of Bitcoin.
“Banana” logic behind Brandt’s 2029 price geometry
For the confused, the “banana” is Brandt’s shorthand for Bitcoin’s curved, multi-year growth channel. Since 2012, the price has oscillated between a lower green boundary, which has marked deep cyclical retracements, and an upper red band, which has coincided with speculative excess.
Currently, with the price of Bitcoin trading in the high-$60,000 range after peaking near $92,000 in January 2026, the asset sits in the middle of this range far from historic extremes.
HOT Stories
XRP Records Largest On-Chain Realized Loss Spike Since 2022
Ripple Partners With Deutsche Bank, $2 Billion in Bitcoin Scooped by Whales, Schwartz Criticizes Logan Paul, Shiba Inu Price Enters Consolidation — Top Weekly Crypto News
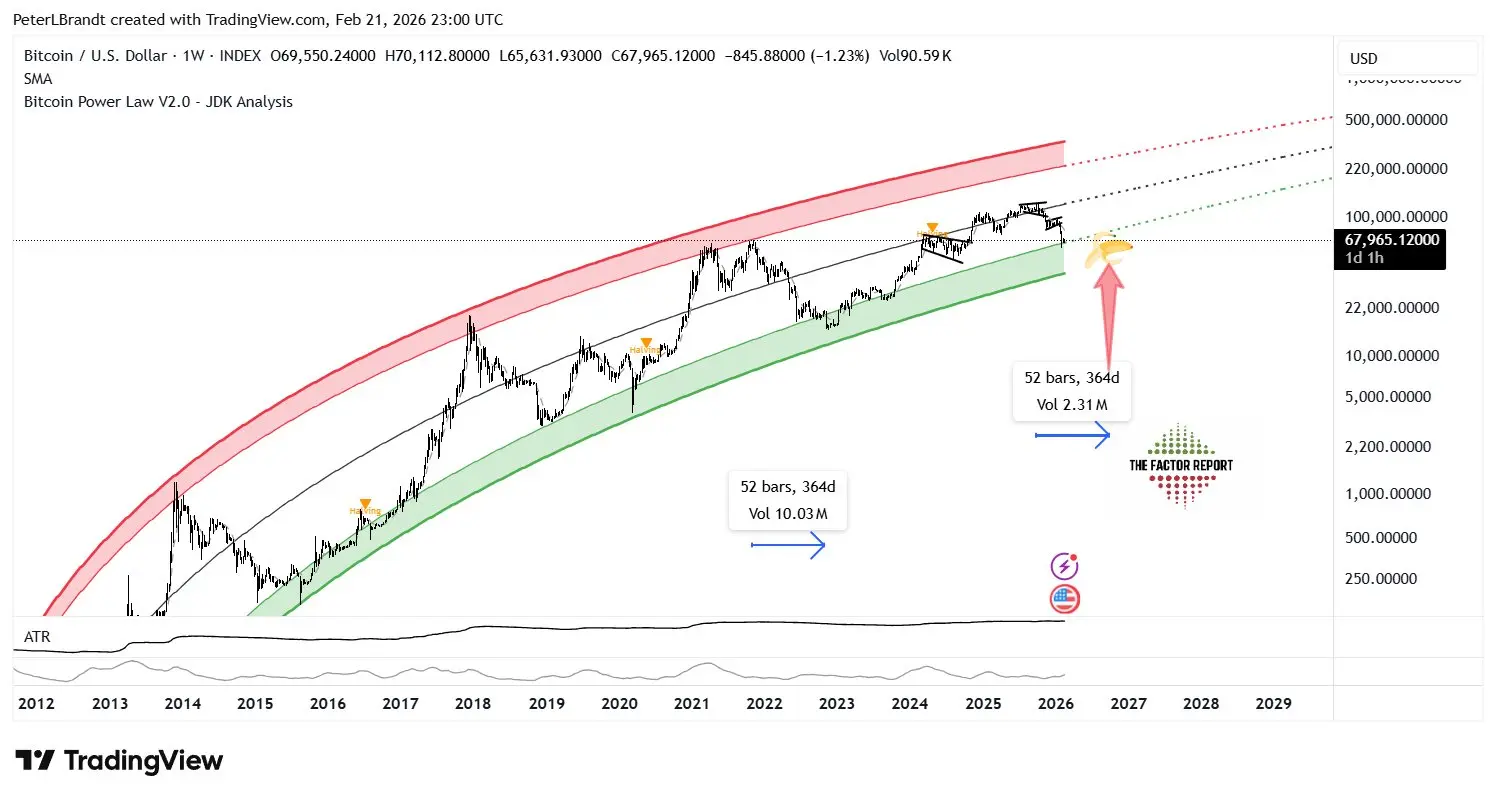 Source: Peter BrandtBrandt’s projection assumes the continuation of a pattern that investors have already witnessed three times: in 2013, 2017 and 2021. Since the timeline stretches across the next halving cycle and into 2029, the “$250,000 BTC” figure is not a prediction for the next quarter, and the trader’s credibility matters here with more than 50 years of experience in the futures market.
The logic behind $250,000 is as mechanical as pure math: if BTC remains within its logarithmic growth corridor and repeats prior cycle behavior, the upper boundary will migrate back to the mid-six-figure range before the end of the decade.
Peter Brandt does not deny Pippen’s optimism for Bitcoin but insists that long-term geometry still governs the price of it.
Disclaimer: The information on this page may come from third parties and does not represent the views or opinions of Gate. The content displayed on this page is for reference only and does not constitute any financial, investment, or legal advice. Gate does not guarantee the accuracy or completeness of the information and shall not be liable for any losses arising from the use of this information. Virtual asset investments carry high risks and are subject to significant price volatility. You may lose all of your invested principal. Please fully understand the relevant risks and make prudent decisions based on your own financial situation and risk tolerance. For details, please refer to
Disclaimer.
Related Articles
Bitcoin Price Metric Reveals $122K Average Return Over 10 Months
Bitcoin has drawn renewed attention from traders and analysts as data-driven signals suggest a potential upside path into 2027, even amid a recent stretch of muted sentiment. An informal metric developed
CryptoBreaking1m ago
Bitcoin is increasingly linked to the macroeconomic cycle after adjusting for US employment data.
Recent adjustments to U.S. labor market data have significantly altered economic outlooks, reducing job numbers by 862,000. This unexpected change weakened short-term growth expectations and prompted investors to reassess future policy directions. Declining inflation pressures have led to lower bond yields and favorable global financial conditions, causing Bitcoin to rise alongside traditional assets. This indicates a structural shift in Bitcoin's market behavior, as it increasingly responds to macroeconomic factors rather than solely crypto-specific news.
TapChiBitcoin22m ago
Data: If BTC breaks through $70,941, the total liquidation strength of mainstream CEX short positions will reach $918 million.
ChainCatcher reports that, according to Coinglass data, if BTC breaks through $70,941, the total liquidation strength of mainstream CEX short positions will reach $918 million. Conversely, if BTC drops below $64,893, the total liquidation strength of mainstream CEX long positions will reach $726 million.
GateNewsBot25m ago
When the "Old Map" No Longer Applies: A Review of 8 "Failing Classic Cryptocurrency Indicators"
Author: Frank, PANews
In early 2026, the cryptocurrency market is filled with a sense of frustration and confusion. Bitcoin has retraced approximately 36% from its all-time high set in October 2025, and the market is swinging back and forth between bulls and bears. But what’s causing more unease among crypto investors isn’t just the price itself, but the fact that their traditional indicator systems used to gauge market positions have almost all failed.
The S2F model’s $500,000 prediction has deviated by more than three times from reality. The four-year cycle has been delayed after the halving, with no explosive rally in sight. The Pi Cycle Top indicator has remained silent throughout the entire cycle. The fixed threshold of the MVRV Z-Score no longer triggers signals, and the top zone of the rainbow chart has become unreachable. Meanwhile, the contrarian signals of the Fear and Greed Index repeatedly prove unreliable, and the highly anticipated “altcoin season” has yet to arrive.
Why have these indicators collectively failed? The answer
区块客25m ago