Litecoin faces correction pressure, bears target the $45 mark
Litecoin (LTC) continues its correction trend, trading below the $50.50 USD level at the time of writing on Wednesday, after losing about 4% in the previous session. The downward pressure is not only reflected on the chart but also reinforced by derivatives data, with open interest (OI) steadily declining while the number of short positions increases. In this context, LTC’s technical outlook still shows no clear signs of improvement.
Litecoin Derivatives Data Show Downtrend
Data from Litecoin futures markets indicate that OI fell back to $328.6 million USD on Tuesday, extending the decline that began in mid-January. The continuous decrease in OI reflects reduced investor participation and sends a pessimistic signal about the short-term market outlook.
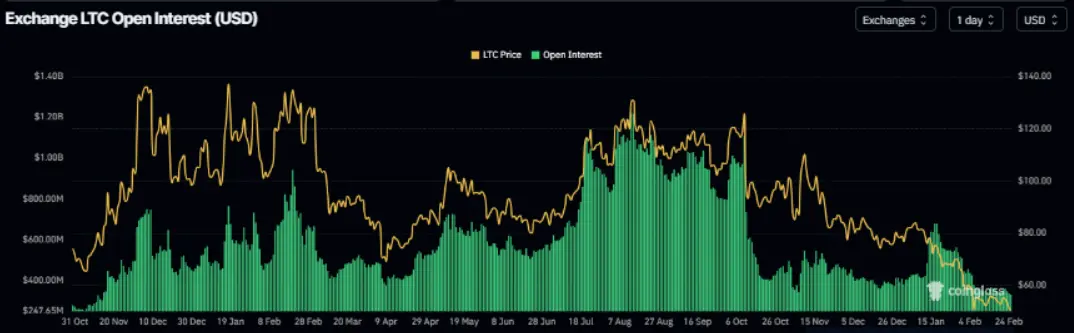 Litecoin Open Interest Volume Chart | Source: Coinglass
Additionally, the long/short ratio for Litecoin was only 0.94 on the same day and has failed to stay above 1 for the third time this month. This suggests traders are cautious about opening new long positions. The long/short ratio below 1 further emphasizes prevailing bearish sentiment, with most of the market leaning toward continued price declines.
Litecoin Open Interest Volume Chart | Source: Coinglass
Additionally, the long/short ratio for Litecoin was only 0.94 on the same day and has failed to stay above 1 for the third time this month. This suggests traders are cautious about opening new long positions. The long/short ratio below 1 further emphasizes prevailing bearish sentiment, with most of the market leaning toward continued price declines.
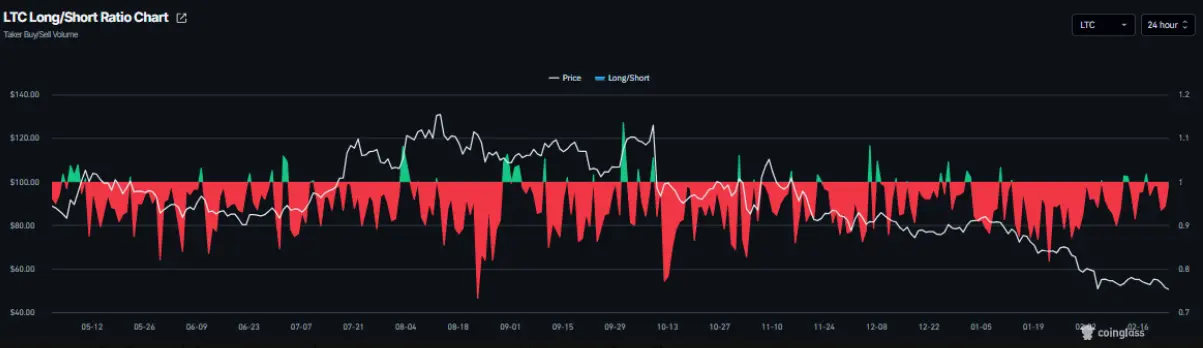 Litecoin Buy/Sell Short Ratio Chart | Source: Coinglass
Litecoin Price Forecast: Bears Target $45
As of Wednesday, Litecoin’s price hovered around $50.39 USD. The 50-day exponential moving average (EMA) continues to slope downward and is currently at $62.36 USD, reinforcing the bearish trend as the price remains below this level. Every recovery attempt quickly weakens near the 50-day EMA, indicating bulls lack the strength to trigger a reliable reversal.
On the daily timeframe, the MACD remains above its signal line and close to zero. However, the positive histogram is shrinking, reflecting diminishing bullish momentum and ongoing correction risks.
The Relative Strength Index (RSI) stands at 32.26, below the neutral 50 level. This indicates selling pressure still dominates, and RSI approaching oversold territory suggests the market could soon see technical rebounds, although there is not enough evidence yet to confirm a trend reversal.
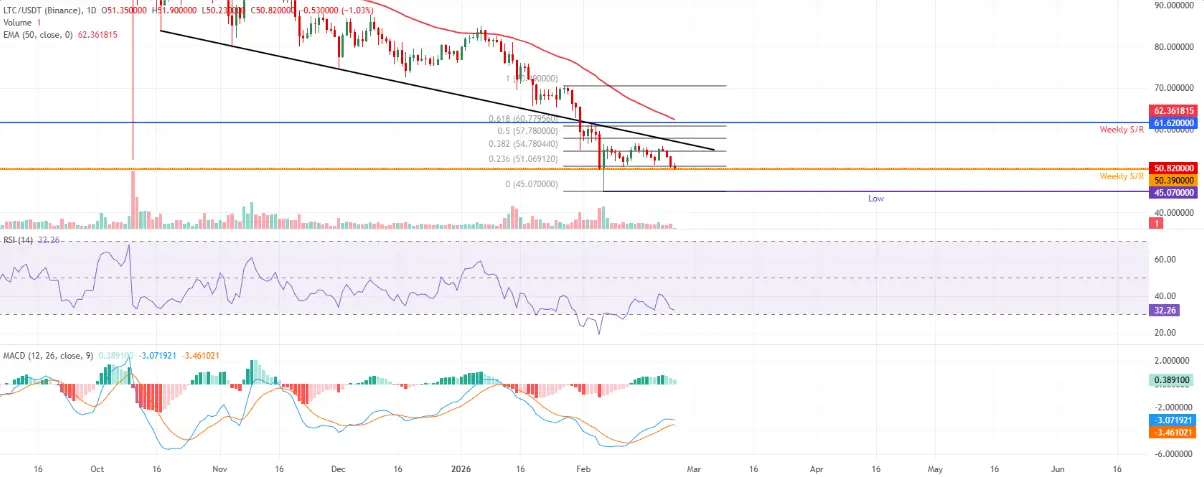 Daily LTC/USDT Chart | Source: TradingView
Based on Fibonacci retracement from the high of $70.49 USD to the low of $45.07 USD, the 23.6% level at $51.06 USD acts as a short-term resistance zone. Further, the 38.2% retracement at $54.78 USD remains a significant barrier for recovery. On the downside, immediate support is around $50.39 USD, while higher resistance is identified at $61.62 USD.
Daily LTC/USDT Chart | Source: TradingView
Based on Fibonacci retracement from the high of $70.49 USD to the low of $45.07 USD, the 23.6% level at $51.06 USD acts as a short-term resistance zone. Further, the 38.2% retracement at $54.78 USD remains a significant barrier for recovery. On the downside, immediate support is around $50.39 USD, while higher resistance is identified at $61.62 USD.
In a bullish scenario, if the price breaks above and sustains over $51.06 USD, Litecoin could extend its recovery toward $54.78 USD. Conversely, a daily close below $50.39 USD is likely to trigger new selling pressure, pushing the price back to test the February 6 low of $45.07 USD, consistent with the prevailing downtrend.
Related Articles
Bitcoin "Exchange Whale Ratio" soars to 0.64, the highest since 2015. Is this a warning sign of selling pressure or a turning point?
Crypto Market Shows Slight Recovery Despite Persistent Extreme Fear
Average profit per person is 85 million, surpassing Goldman Sachs and NVIDIA. The world's most profitable business isn't AI.
Schiff Warns Bitcoin Surge May Falter Ahead of Trump Speech