Zcash faces the risk of a plunge to $120 if it loses the key support level
Cryptocurrency focusing on privacy Zcash (ZEC) is experiencing one of the sharpest declines in the market, with its value evaporating in double digits over just a few recent trading sessions.
This persistent weakening has quickly raised serious concerns within the investor community: Can ZEC find support and stabilize around its current levels, or is the selling pressure not yet over, with a deeper decline looming ahead?
Market Structure
Since the beginning of the year, ZEC has seen a significant drop of approximately 62%, with hardly any convincing signals of a sustainable recovery or a notable rebound confirming a trend reversal.
Currently, the asset is trapped in a narrow accumulation zone on the chart, fluctuating around $205–$225. Notably, this price range has previously served as an important support twice, making it a key technical level for the upcoming movement.
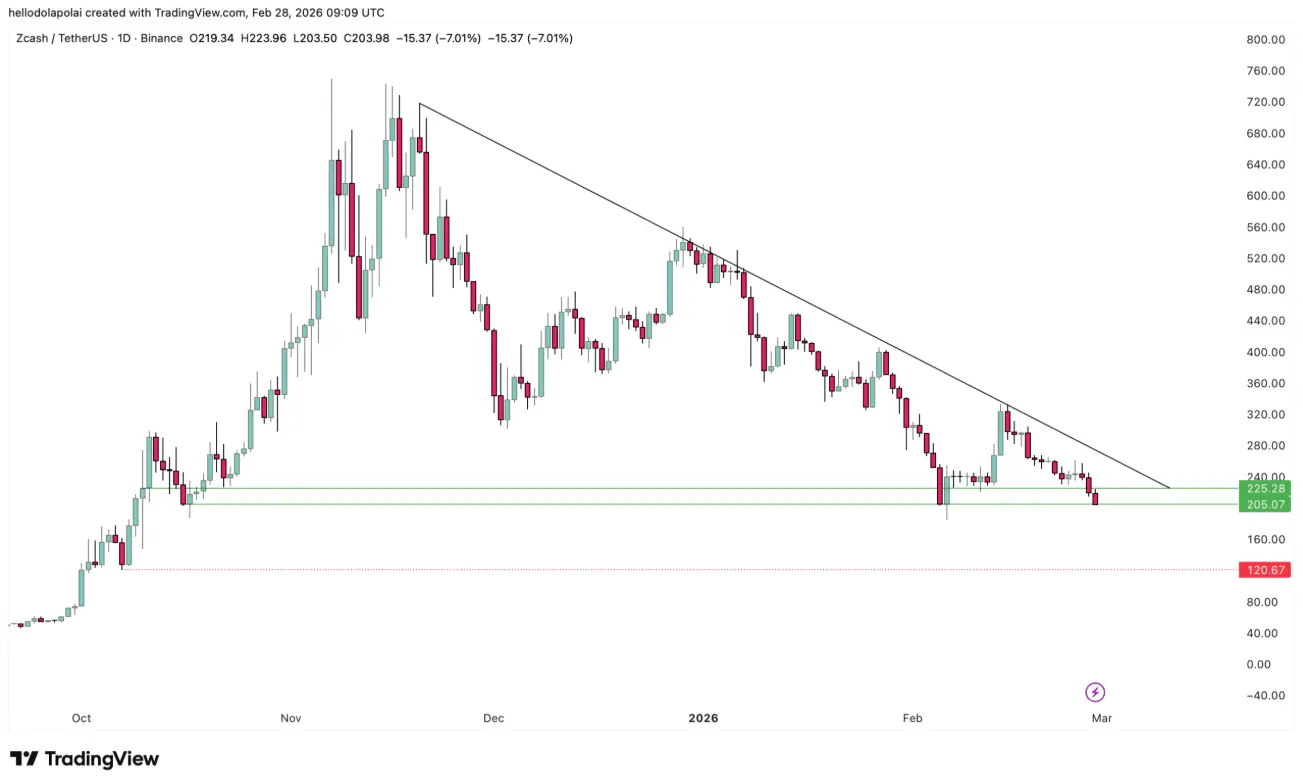 Daily ZEC/USDT Chart | Source: TradingView This area is likely to determine ZEC’s next direction. If the bulls continue to successfully defend this support zone, the market could see a new recovery phase. However, in a more negative scenario, a break below this level would open the risk of a sharp decline, potentially leading to losses far exceeding previous corrections.
A clear break below the current support could push the price toward the next support zone around $120 — roughly a 30% decrease from the current price.
This development would not only severely weaken the overall trend structure but also put long-term investors under psychological pressure and increasing risk.
Indicators Showing Prolonged Weakness
Technical indicators are collectively confirming a pessimistic market scenario. Capital outflows continue, as evidenced by the declining Money Flow Index (MFI).
The MFI reflects the strength of money entering and leaving the market on a scale from 0 to 100. Typically, the 50–80 range indicates a bullish trend, while 20–50 suggests weakening momentum. When the MFI drops below 20, the market is often considered oversold.
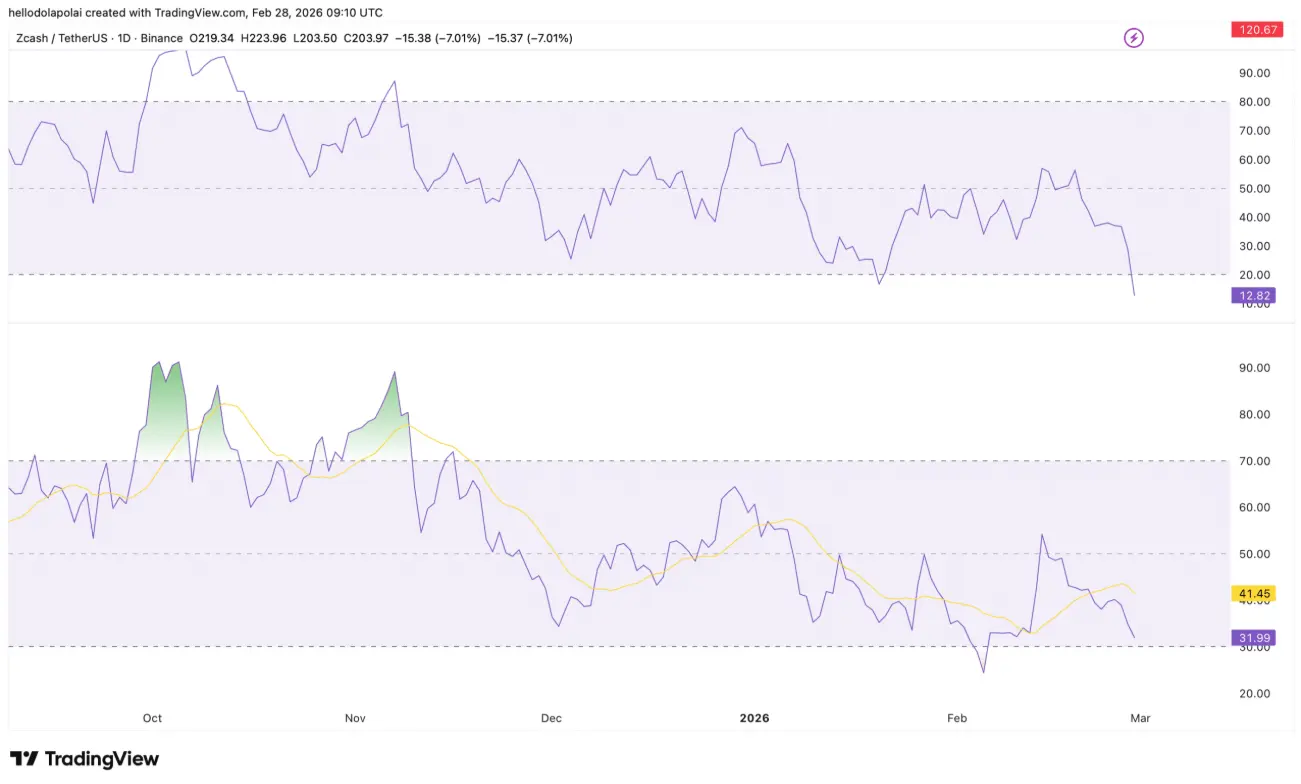 Daily ZEC/USDT Chart | Source: TradingView Currently, ZEC’s MFI has fallen to 18. While this threshold may indicate that selling pressure is waning, it is not enough to guarantee an immediate reversal. With no clear accumulation signals in the market, cautious sentiment still dominates among investors.
Additionally, the Relative Strength Index (RSI) — a measure of price momentum — has fallen below the neutral 50 level and continues to decline. This trend reflects diminishing buying strength and confirms that the downward trend remains dominant on the chart.
Where Will ZEC Go?
The heatmap provides an intuitive view of short-term price volatility scenarios. Currently, large liquidity clusters are concentrated above the current price — a factor that could act as a “magnet,” pulling the price upward, as markets tend to gravitate toward areas with high liquidity.
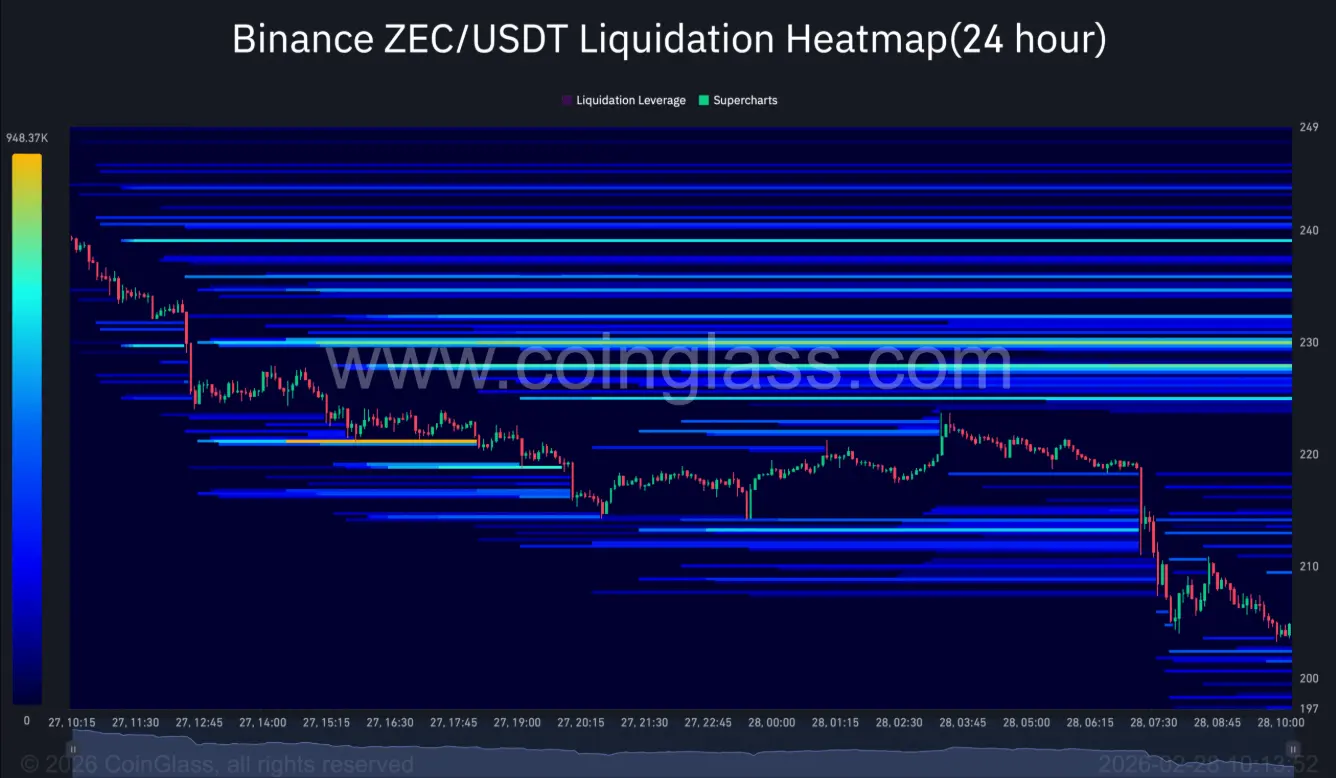 Source: CoinGlass This structure opens the possibility of a short-term technical rebound. However, the presence of lower liquidity clusters around $197 cannot be ignored. The price could undergo a slight correction to sweep liquidity in this zone before accumulating enough momentum for a clearer upward move toward higher liquidity areas.
Although the heatmap indicates room for further gains, market sentiment and current momentum remain fragile. Until the bulls regain key price levels and technical indicators confirm a sustainable improvement, ZEC remains at risk of continued correction.