VIRTUAL surges 9%, approaching a key resistance: Is the $0.85 level in sight?
Virtuals Protocol (VIRTUAL) is currently fluctuating around the $0.699 level on the 4-hour chart as the market approaches the upper boundary of a gradually narrowing accumulation zone. Previously, the price made a notable rebound from the $0.64 support area, creating a strong bullish impulse that pushed VIRTUAL directly toward the key resistance zone of $0.70–$0.72.
Notably, the Bollinger Bands are beginning to widen after a period of contraction, indicating that volatility is returning to the market. The middle band around $0.65 now acts as a critical dynamic support zone, coinciding with the horizontal support at $0.6508, further strengthening the reliability of this price level.
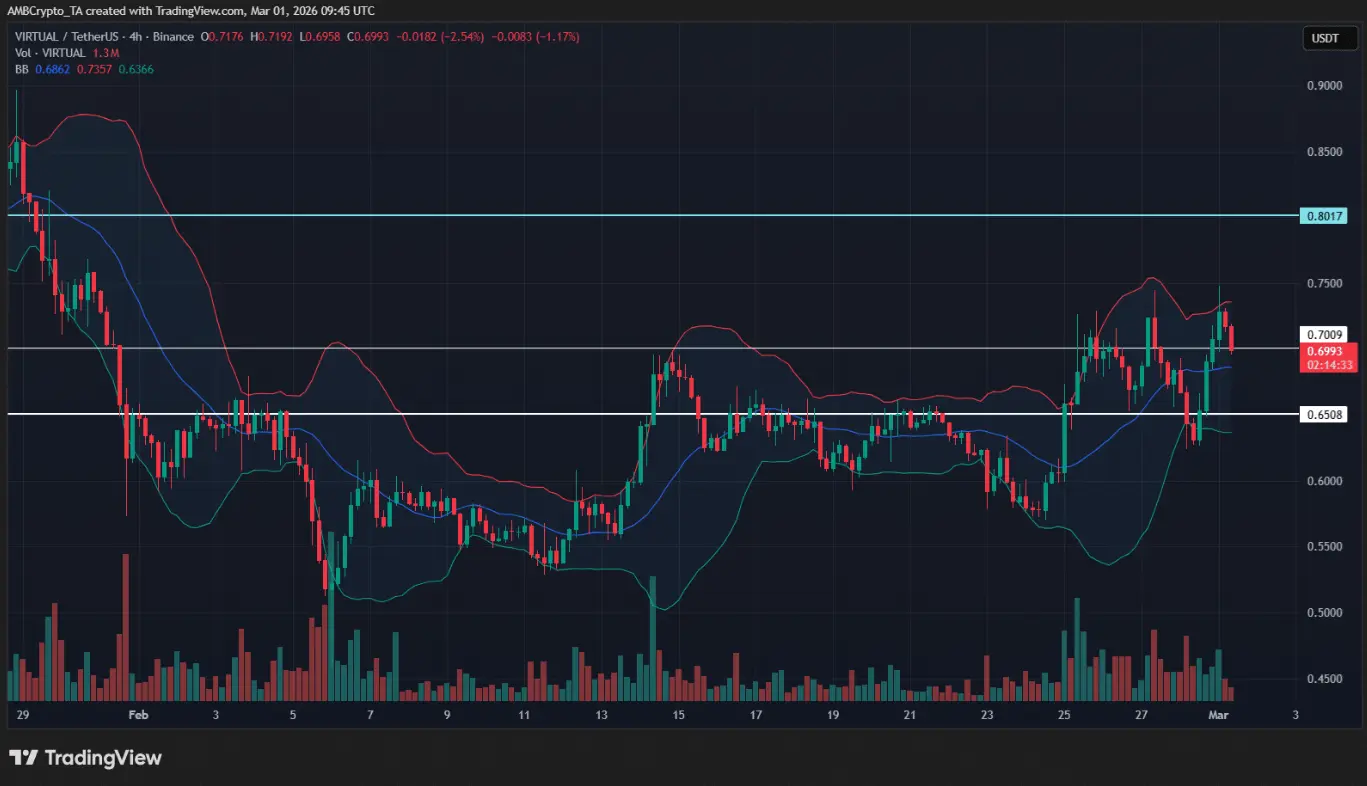 Source: TradingView However, selling pressure has not disappeared. Recent candles consistently show long upper wicks in the $0.71–$0.72 range, reflecting strong bearish defense at the resistance corridor. Meanwhile, trading volume has significantly increased during the rally from $0.64 to $0.71, indicating that capital inflow is purposeful rather than temporary.
Currently, the market is entering a slight correction phase as the price consolidates around the $0.70 mark, showing hesitation before a major trend decision.
This development highlights the structural role of the $0.72 zone. A decisive close above this level would confirm a breakout scenario and signal an extension of the bullish trend. Conversely, if it fails, the price could retest the support at $0.65 before establishing the next move.
VIRTUAL Momentum Accelerating
After successfully testing the resistance zone around $0.72, VIRTUAL’s bullish momentum continues to strengthen as the token extends its impressive recovery in recent times. At press time, VIRTUAL has gained about 9%, with daily trading volume surpassing $125 million—a sign that market participation is increasing significantly.
Additionally, the derivatives market also shows positive signals, reinforcing the current uptrend. Open interest has risen to approximately $84 million, an 11% increase, reflecting continuous capital inflow that supports the rising price.
The synchronization between price and open interest often indicates sustained investor confidence, rather than short-term speculative rallies.
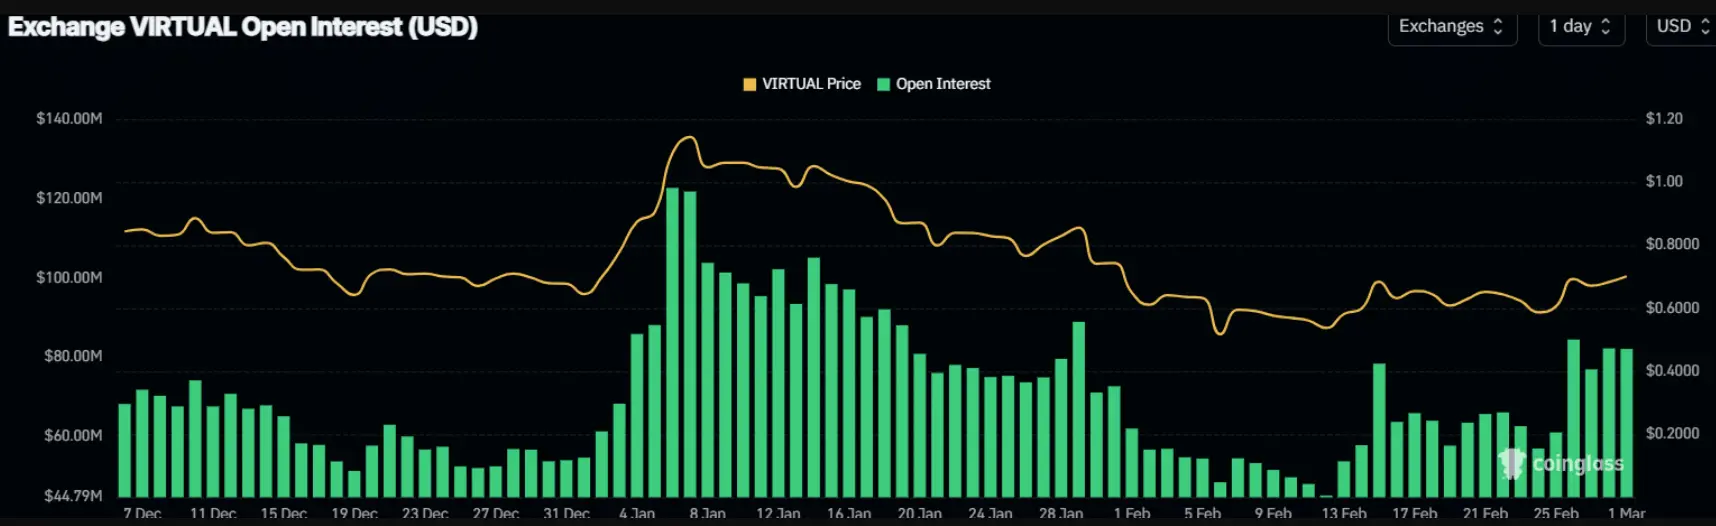 Source: CoinGlass From a technical perspective, the price structure shows VIRTUAL approaching a multi-month downtrend line—considered a key barrier for the medium-term trend. Notably, this breakout attempt occurs amid market expectations for the upcoming AI DAPP launch scheduled for March.
Overall, supporting factors are gradually strengthening demand, while traders continue to closely monitor the resistance at $0.74 and the critical support at $0.62 to assess the market’s next move.
VIRTUAL Targets $0.85 if Breakout Structure Forms
VIRTUAL is currently trading around $0.70 on the 4-hour chart, in a tight accumulation phase just below the important resistance of $0.72, after breaking out of a multi-week downtrend structure.
Previously, the price made a significant rebound from the $0.65 support zone, forming a series of higher lows—a technical signal indicating selling pressure is weakening and the supply–demand balance is shifting in favor of buyers.
Alongside this, short-term moving averages around $0.67–$0.68 have turned upward, reflecting positive momentum improvement.
The RSI indicator remains around 56, suggesting price strength is balanced and not yet overbought. This implies room for further upside and that bulls are not yet exhausted.
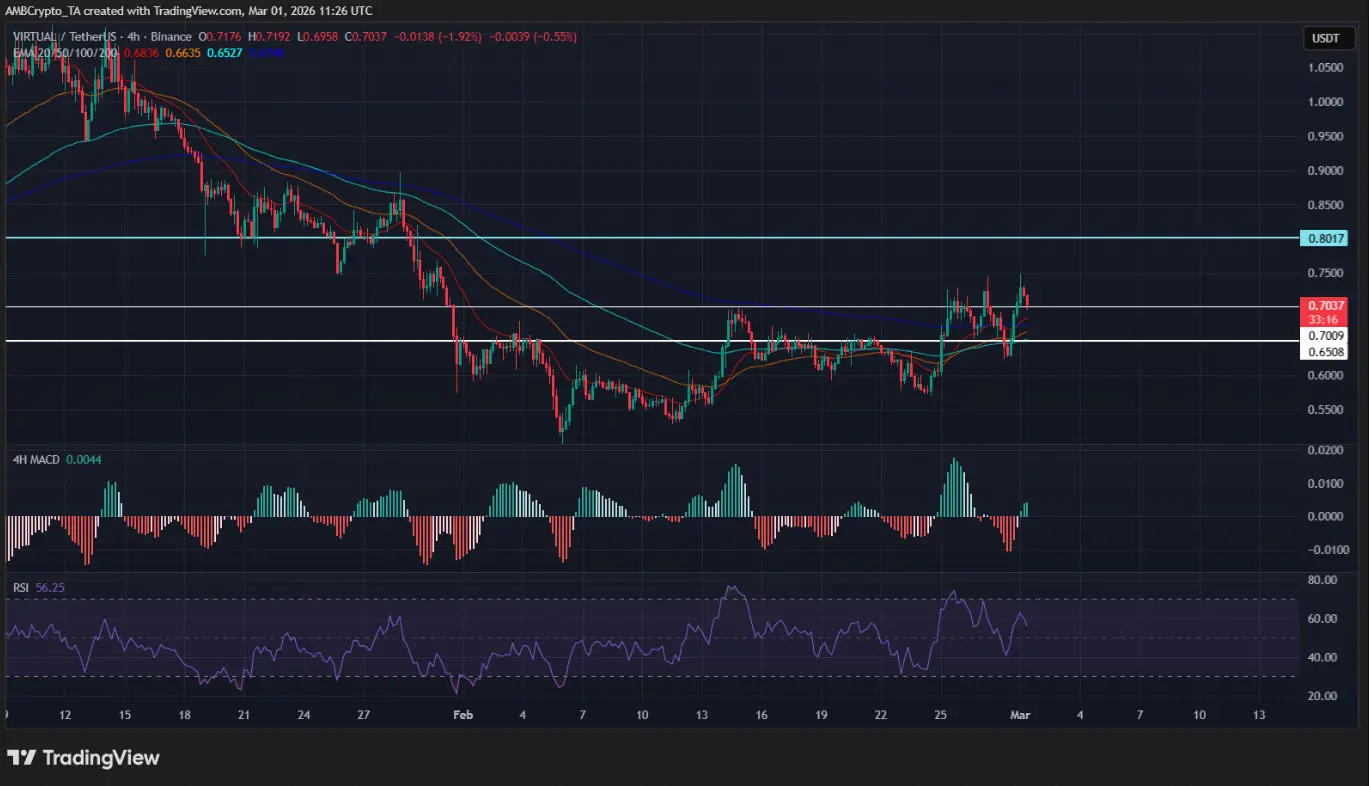 Source: TradingView Additionally, the MACD histogram has shifted into positive territory, confirming a potential trend reversal and a gradual transition to an uptrend.
As the consolidation range narrows just below $0.72, the market is approaching a decisive breakout point.
If a 4-hour candle closes decisively above $0.7416, the bullish scenario could be triggered, opening targets in the $0.84–$0.90 zone. Conversely, if the price is rejected at resistance, VIRTUAL is likely to retest the strong demand zone around $0.62–$0.63.