Trade
Basic
Futures
Futures
Hundreds of contracts settled in USDT or BTC
Options
HOT
Trade European-style vanilla options
Unified Account
Maximize your capital efficiency
Demo Trading
Futures Kickoff
Get prepared for your futures trading
Futures Events
Futures Mall
Participate in events to win generous rewards
Demo Trading
Use virtual funds to experience risk-free trading
Earn
Launch
CandyDrop
Collect candies to earn airdrops
Launchpool
Quick staking, earn potential new tokens
HODLer Airdrop
Hold GT and get massive airdrops for free
Launchpad
Be early to the next big token project
Alpha Points
NEW
Trade on-chain assets and enjoy airdrop rewards!
Futures Points
NEW
Earn futures points and claim airdrop rewards
Investment
Simple Earn
Earn interests with idle tokens
Auto-Invest
Auto-invest on a regular basis
Dual Investment
Buy low and sell high to take profits from price fluctuations
Soft Staking
Earn rewards with flexible staking
Crypto Loan
0 Fees
Pledge one crypto to borrow another
Lending Center
One-stop lending hub
VIP Wealth Hub
Customized wealth management empowers your assets growth
Private Wealth Management
Customized asset management to grow your digital assets
Quant Fund
Top asset management team helps you profit without hassle
Staking
Stake cryptos to earn in PoS products
Smart Leverage
NEW
No forced liquidation before maturity, worry-free leveraged gains
GUSD Minting
Use USDT/USDC to mint GUSD for treasury-level yields
More
# 📉
3.22K
Dark_Angel
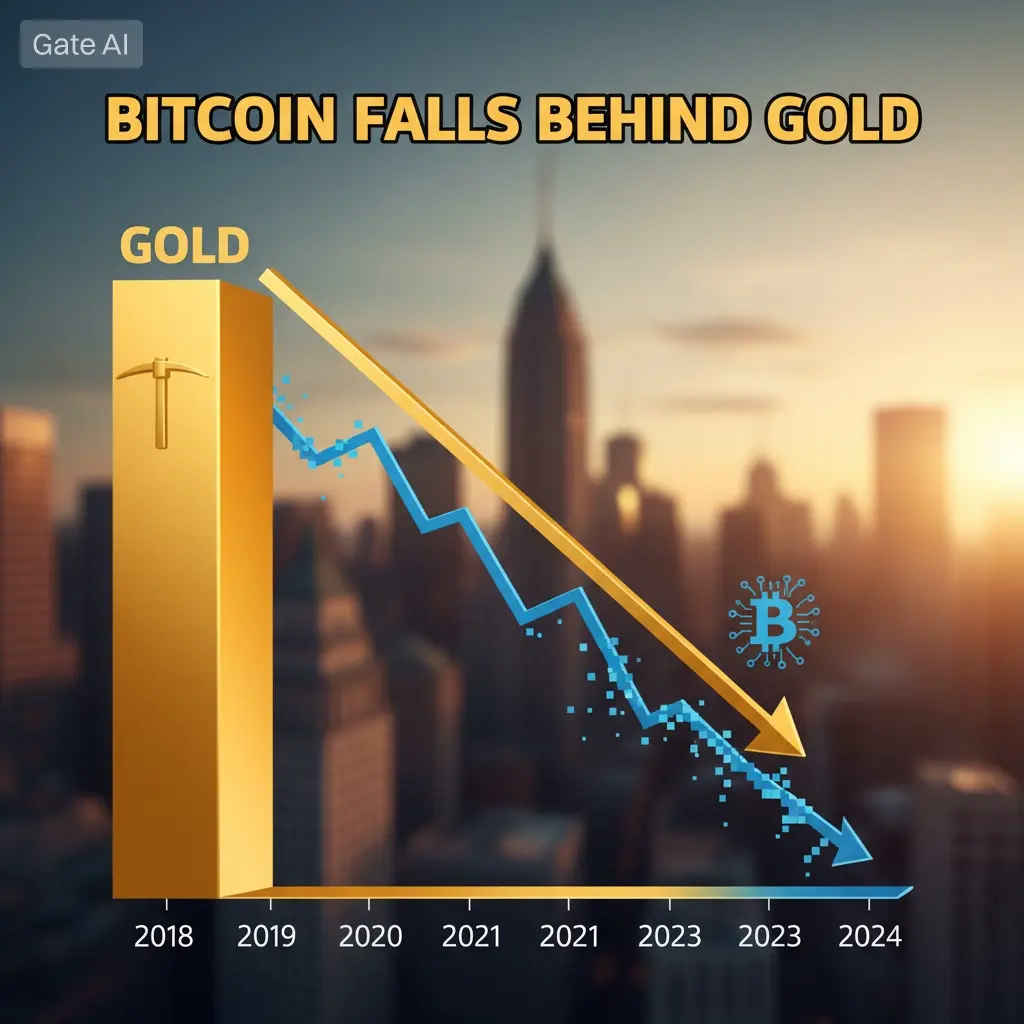
#📉 #BitcoinFallsBehindGold BitcoinFallsBehindGold
As global uncertainty rises, Bitcoin is currently falling behind gold in the race for safe-haven dominance. While BTC faces short-term pressure from macro risks and reduced risk appetite, gold continues to attract strong capital flows, reaching new record highs.
🔶 Gold’s Strength
Gold is benefiting from safe-haven demand as investors seek stability amid geopolitical tensions, tariff concerns, and shifting monetary expectations. Its performance highlights trust in traditional value-preserving assets during volatile periods.
🔷 Bitcoin’s Positi
BTC0,73%
- Reward
- 1
- 5
- Repost
- Share
AylaShinex :
:
1000x VIbes 🤑View More
# 📉 Bloodbath in the cryptocurrency market: Liquidation frenzy worth 19 billion Dollar!
Wow, what an intense ride! 🎢 The cryptocurrency market just witnessed **the largest single-day liquidation ever** - a massive 19 billion Dollar wiped out in leveraged positions!
## 💥 Damage Report:
• **Bitcoin**: It collapsed from 122 thousand Dollar to 102 thousand Dollar (Oh no! 😱)
• **Ethereum**: fell below 3,500 Dollar
• **Total victims**: 1.6 million traders have been crushed
• **Buying vs Selling**: Liquidation of 16.6 billion Dollar in long positions versus 2.4 billion Dollar in short positions.
View OriginalWow, what an intense ride! 🎢 The cryptocurrency market just witnessed **the largest single-day liquidation ever** - a massive 19 billion Dollar wiped out in leveraged positions!
## 💥 Damage Report:
• **Bitcoin**: It collapsed from 122 thousand Dollar to 102 thousand Dollar (Oh no! 😱)
• **Ethereum**: fell below 3,500 Dollar
• **Total victims**: 1.6 million traders have been crushed
• **Buying vs Selling**: Liquidation of 16.6 billion Dollar in long positions versus 2.4 billion Dollar in short positions.
- Reward
- like
- Comment
- Repost
- Share
According to the market analysis on the morning of November 26, 2025, Ethereum (ETH) is currently at a critical technical point, facing pressure at the **3000 USD** level above, while there is important support around **2860 USD** below.
The following is a summary of key price level information organized for you based on analysts' views from the internet.
| **Direction** | **Price** | **Additional Notes** |
| :--- | :--- | :--- |
| **Resistance Level Above** | 🟡 **3000 USD** | This is the most direct psychological barrier and technical resistance currently.
| | 🟡 **3060-3100 USD** | If i
ETH1,36%
- Reward
- 1
- Comment
- Repost
- Share
#BAS # BAS coin analysis - A look at the last 24 hours 📊
Hello my friend! 👋 Let me share with you a quick look at what has happened to BAS coin in the last 24 hours!
## 📉 Price Performance:
- We are witnessing a sharp decline in the price of BAS from 0.026957 to 0.016937, a drop of approximately 37%.
- The decline was sharper between the hours of 18:00-04:00, during which the coin lost most of its value.
- Trading volume has increased significantly during downturns, indicating intensive selling.
## 🔍 Community Information:
- Discussions have been observed in groups such as "猎蛙投研" and "Alph
BAS0,99%
- Reward
- 3
- Comment
- Repost
- Share
Understood ✅ The sudden surge in gold prices last night has indeed attracted the attention of many investors, which is the result of multiple market factors resonating. The main reasons can be attributed to the safe-haven demand triggered by weak U.S. economic data and the rising expectations for a Federal Reserve interest rate cut.
---
### 📉 Weak U.S. economic data raises risk aversion.
The poor performance of several U.S. economic data released on November 10 became a direct catalyst for the rise in gold prices.
- **Deterioration of the Job Market**: The U.S. "Challenger" job data shows th
View Original---
### 📉 Weak U.S. economic data raises risk aversion.
The poor performance of several U.S. economic data released on November 10 became a direct catalyst for the rise in gold prices.
- **Deterioration of the Job Market**: The U.S. "Challenger" job data shows th
- Reward
- like
- Comment
- Repost
- Share
Binance Coin (BNB) is affected by macroeconomic factors, with prices under pressure and technical analysis indicating a short-term bearish bias. Below are the operational suggestions based on the current market conditions and information.
### 📉 Current Market Highlights
Price and Trend: As of December 23,, BNB is trading around **850 USD**, testing the key support level at **838 USD**. Since the US released unexpectedly high inflation data in December, BNB has adjusted along with the overall cryptocurrency market.
Technical Signals: Multiple technical indicators are issuing **bearish signals*
View Original### 📉 Current Market Highlights
Price and Trend: As of December 23,, BNB is trading around **850 USD**, testing the key support level at **838 USD**. Since the US released unexpectedly high inflation data in December, BNB has adjusted along with the overall cryptocurrency market.
Technical Signals: Multiple technical indicators are issuing **bearish signals*
- Reward
- like
- Comment
- Repost
- Share
ETH/USDT Trading Strategy Analysis (November 17, 2025) ##### 📉 Technical Analysis 1. Price Patterns - The 4-hour chart shows a descending channel, with the recent low of $3,003 (November 16) forming key support. - The head and shoulders pattern is taking shape (right shoulder at $3,240), if it breaks below the neckline at $3,150, it will confirm the downside. 2. Indicator Signals - MACD: DIF and DEA cross below the zero line, increasing bearish momentum. - RSI # 📊 综合结论短期趋势:震荡偏空 关键价位:支撑位 $3,000(心理关口),阻力位 $3,240(24H高点) 操作建议:轻仓观望,突破 $3,240 可试多,跌破 $3,000 需止损。---#1H(: 42 (neutral to weak), not
ETH1,36%
- Reward
- 1
- Comment
- Repost
- Share
Load More
Join 40M users in our growing community
⚡️ Join 40M users in the crypto craze discussion
💬 Engage with your favorite top creators
👍 See what interests you
Trending Topics
35.09K Popularity
845 Popularity
583 Popularity
107 Popularity
385 Popularity
136 Popularity
224 Popularity
106 Popularity
67.6K Popularity
108.87K Popularity
76.05K Popularity
19.1K Popularity
42.99K Popularity
36.15K Popularity
192.15K Popularity
News
View MoreOCBC Bank: Silver enters a structural bull market, significantly raising the Q1 2026 target price to $117
1 m
Will Bitcoin drop below $70,000? Stablecoin withdrawals, CEX premium turning negative, and miner selling pressure all hitting simultaneously
2 m
Gate Index Zone will launch US30, HK50, and JPN225 perpetual contracts for the first time on January 27, supporting 1-10x leverage trading.
7 m
Cardano whale spends $161 million to buy ADA, is $0.35 the key watershed?
7 m
Ethereum Gas fees drop back to 2017 levels, but transaction volume hits a new all-time high, showcasing the results of ETH scalability improvements
8 m
Pin