Trade
Basic
Futures
Futures
Hundreds of contracts settled in USDT or BTC
Options
HOT
Trade European-style vanilla options
Unified Account
Maximize your capital efficiency
Demo Trading
Futures Kickoff
Get prepared for your futures trading
Futures Events
Participate in events to win generous rewards
Demo Trading
Use virtual funds to experience risk-free trading
Earn
Launch
CandyDrop
Collect candies to earn airdrops
Launchpool
Quick staking, earn potential new tokens
HODLer Airdrop
Hold GT and get massive airdrops for free
Launchpad
Be early to the next big token project
Alpha Points
NEW
Trade on-chain assets and enjoy airdrop rewards!
Futures Points
NEW
Earn futures points and claim airdrop rewards
Investment
Simple Earn
Earn interests with idle tokens
Auto-Invest
Auto-invest on a regular basis
Dual Investment
Buy low and sell high to take profits from price fluctuations
Soft Staking
Earn rewards with flexible staking
Crypto Loan
0 Fees
Pledge one crypto to borrow another
Lending Center
One-stop lending hub
VIP Wealth Hub
Customized wealth management empowers your assets growth
Private Wealth Management
Customized asset management to grow your digital assets
Quant Fund
Top asset management team helps you profit without hassle
Staking
Stake cryptos to earn in PoS products
Smart Leverage
NEW
No forced liquidation before maturity, worry-free leveraged gains
GUSD Minting
Use USDT/USDC to mint GUSD for treasury-level yields
More
# Solana
1.6M
CryptoAnalyZen
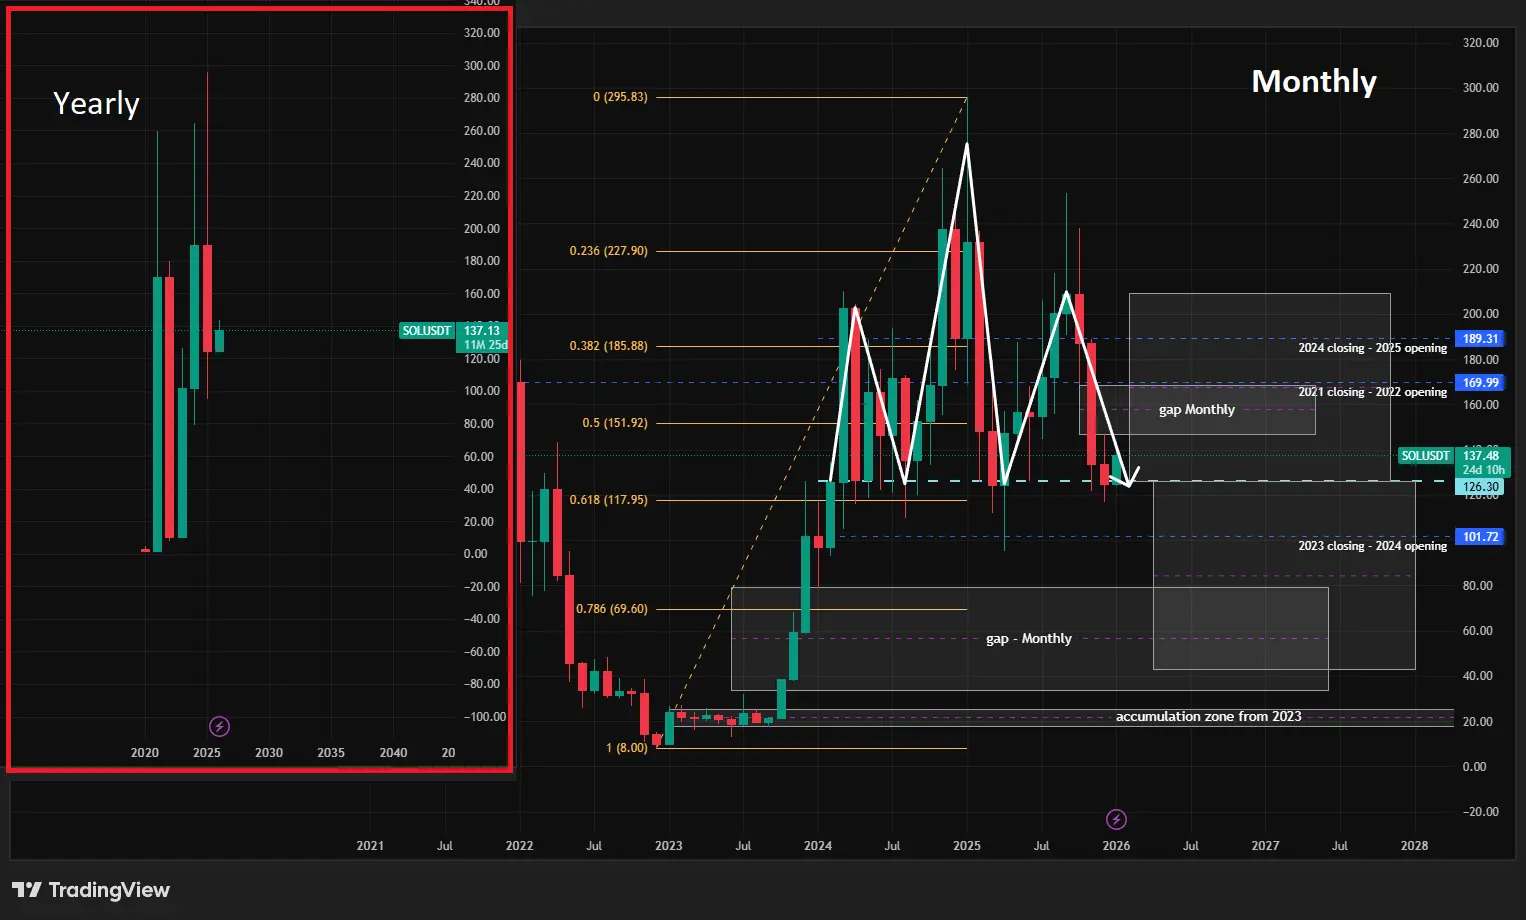
$SOL update – annual and monthly structure
Previously, my outlook for Solana was more optimistic, expecting higher prices toward the end of 2025. At present, the technical picture looks more dramatic.
On the annual chart, SOL usually forms very wide yearly ranges. The 2025 red candle with an ATH at 295.83 weakens the bullish case.
On the monthly chart, a clear head-and-shoulders structure is visible, with the neckline around 126.30. The downside projection of the last shoulder intersects with the gap zone and suggests potential continuation below the 78% Fibonacci retracement of the 8.00–295.
SOL-5,15%
- Reward
- like
- Comment
- Repost
- Share
0.44 or so, buy the dip opportunity, increase the position on dips. The top on-chain derivatives exchange on Solana, a project that can go beyond the bull and bear markets. With reference to Derbit's centralized options platform user base and profits, it has the potential to achieve amazing profits. The profits during testing and promotional periods have already reached tens of millions in a year. #DRIFT #BOME #MAGA #NOT #Solana
View Original
- Reward
- 5
- Comment
- Repost
- Share
#Solana #BONKSolana
📰 #Actualités
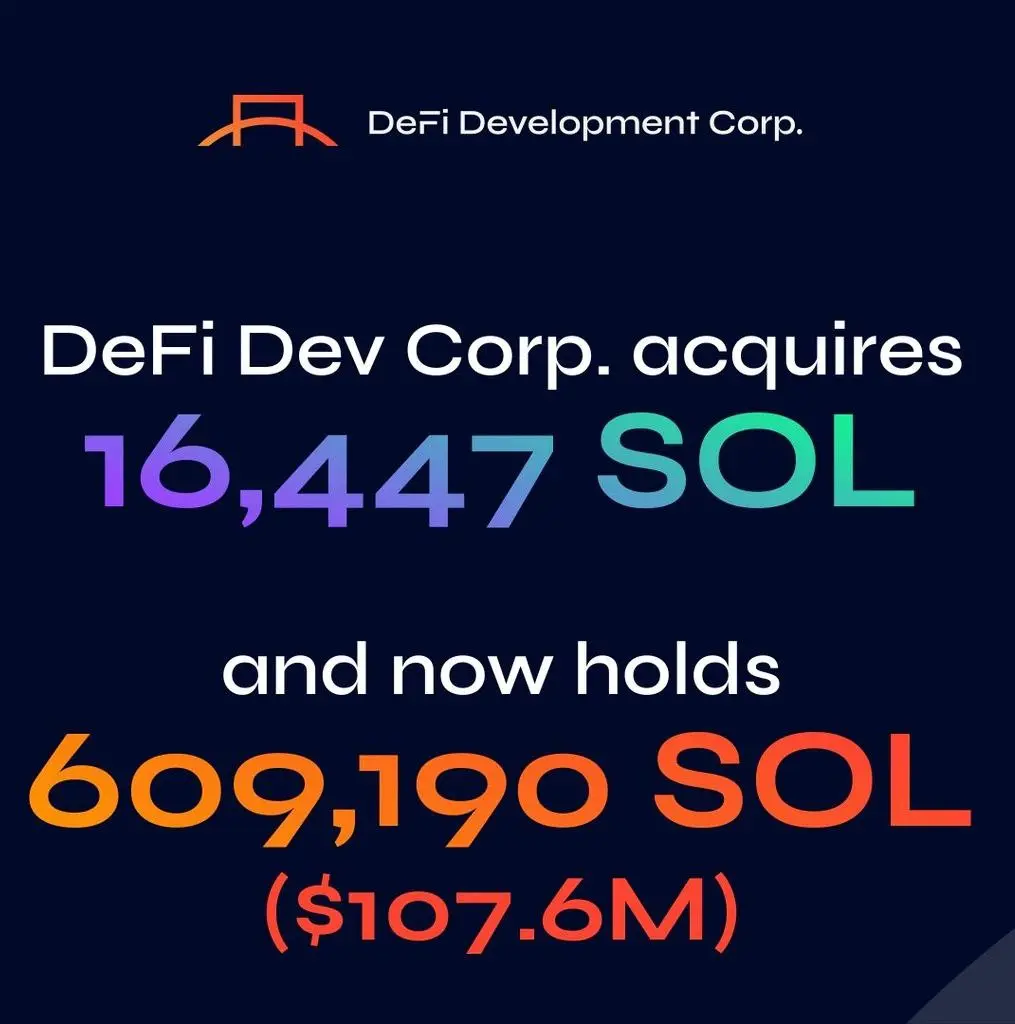
DeFi Development Corp. has acquired 16,447 SOL, bringing its total portfolio to 609,190 SOL with a value of approximately 107 million dollars.
The company also announced a partnership with BONK to co-manage a validator on Solana.
Source : 🗞 Defidevcorp
View Original📰 #Actualités
DeFi Development Corp. has acquired 16,447 SOL, bringing its total portfolio to 609,190 SOL with a value of approximately 107 million dollars.
The company also announced a partnership with BONK to co-manage a validator on Solana.
Source : 🗞 Defidevcorp

- Reward
- like
- 1
- Repost
- Share
CryptoInfos :
:
Ape In 🚀
As expected, Solana is now priced at $162.35, and SLERF based on SPL-20 has also reached a new high since the last global financial turmoil, breaking through $0.17. I have been watching this coin closely recently and I think it's time to buy the dip. My robot also made a profit on this day, let's go and catch the bottom together. #SLERF #Solana
View OriginalWhat do you think of my robot strategy?
take profit set too small
1
1
Parameter settings are good.
1
1
The timing of the strategy's start is unfortunate
1
1
3 ParticipantsVoting Finished
[The user has shared his/her trading data. Go to the App to view more.]
- Reward
- 1
- Comment
- Repost
- Share
🔥 Bitcoin ETF demand slows but stays positive!
The bull run continues as long as ETF inflows remain strong.
The real turning point comes when consistent ETF outflows start.
That’s when the trend truly changes.
🐦🔥 Solana now has 10x more daily active users than Eth & Btc!.
The tipping point happened in Jan 2024 and still holding strong.
#BTC #Solana #HotTopicDiscussion
- Reward
- like
- Comment
- Repost
- Share
#SOL #Solana #BONKSolana
📰 #Actualités
DeFi Development Corp. has acquired 16,447 SOL, bringing its total investment portfolio to 609,190 SOL, valued at approximately $107 million.
The company also announced a partnership with BONK to jointly manage a validator on Solana.
Source: 🗞 Defidevcorp
View Original📰 #Actualités
DeFi Development Corp. has acquired 16,447 SOL, bringing its total investment portfolio to 609,190 SOL, valued at approximately $107 million.
The company also announced a partnership with BONK to jointly manage a validator on Solana.
Source: 🗞 Defidevcorp
- Reward
- like
- Comment
- Repost
- Share
Load More
Join 40M users in our growing community
⚡️ Join 40M users in the crypto craze discussion
💬 Engage with your favorite top creators
👍 See what interests you
Trending Topics
12.32K Popularity
37.03K Popularity
47.65K Popularity
14.21K Popularity
9.97K Popularity
338.57K Popularity
6.81K Popularity
8.92K Popularity
106.32K Popularity
16.25K Popularity
178.57K Popularity
14.21K Popularity
6.63K Popularity
9.18K Popularity
167.2K Popularity
News
View MoreThe three major US stock indices plummeted, Nvidia fell over 4%
16 m
The US Dollar Index fell 0.41%, closing at 98.642
28 m
Data: 1,928,900 TON transferred from wallet_v4r2, worth approximately $2,951,200.
1 h
Data: 492.18 BTC transferred from anonymous addresses, worth approximately $44.03 million
1 h
Data: In the past 24 hours, the entire network has been liquidated for a total of $709 million, with long positions liquidated for $649 million and short positions liquidated for $60.451 million.
1 h
Pin