HBAR Price at Critical $0.09 Level as Hedera Approaches Major Buy Wall After BTC Drops Below $65K

The Hedera price has slipped below the $0.10 mark as the broader crypto market continues to struggle. HBAR is now trading around $0.095, sitting just above a key technical support zone. Bitcoin is not helping sentiment either, with the BTC price dipping toward the $65,000 level and dragging altcoins lower in the process.
In this environment, attention has shifted to a crucial level on the HBAR chart: $0.09.
One Hedera community member on X showed this area as a major daily buy wall that could determine the token’s short-term direction.
- The $0.09 Level: Why It Matters
- The Bearish Risk
- Bigger Picture for Hedera
The $0.09 Level: Why It Matters
According to the post, $0.09 represents a big liquidity zone where buyers previously stepped in. As price approaches this level, the key question is whether buyers can absorb incoming sell pressure and defend support.
The tweet outlines a clear bullish scenario. If buyers manage to hold the $0.09 region and begin trapping sellers, momentum could swing back in favor of bulls. The real confirmation would come if HBAR breaks above previous sell walls and flips them into support. That type of behavior signals strength returning to the market.
If that plays out, the community member says they would look for short-term scalp opportunities, with upside targets in the $0.106 to $0.150 range. That would represent a meaningful recovery from current levels, especially in a weak macro backdrop.
The Bearish Risk
The flip side is equally important.
If HBAR loses the $0.09 level with conviction, the structure changes. A breakdown below that support could trigger stop losses and release liquidity below, accelerating downside momentum.
In that scenario, the next major daily buy walls sit between $0.09 and $0.072. The tweet specifically highlights $0.072 as a deeper liquidity zone identified by tracking tools. A move into that range would likely reflect broader market weakness and aggressive selling pressure.
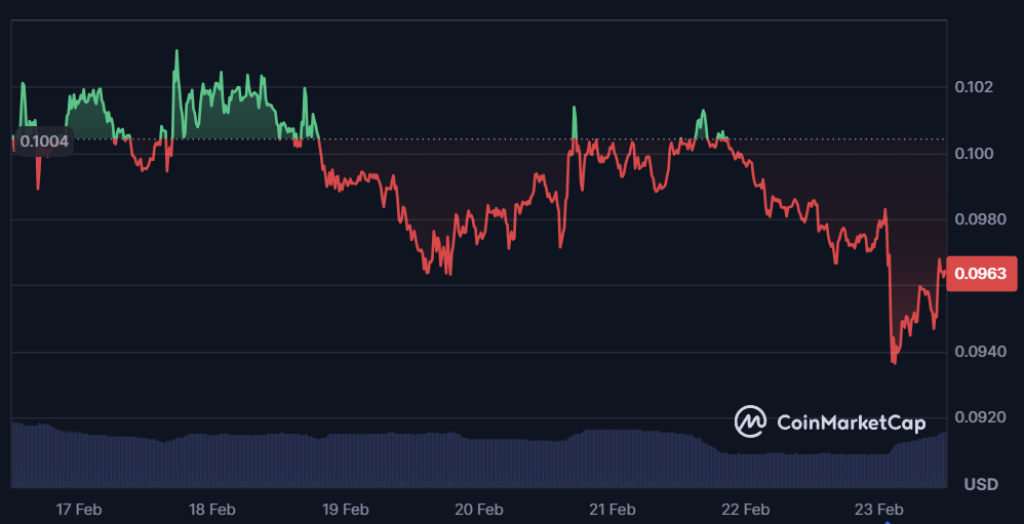
Source: CoinMarketCap/Hedera
In simple terms, $0.09 is the line in the sand.
HBAR’s technical setup cannot be viewed in isolation. Bitcoin slipping toward $65K has weighed on the entire altcoin sector. When BTC loses key levels, liquidity tightens across the board, and altcoins typically experience amplified volatility.
If Bitcoin stabilizes and holds its current range, HBAR may have room to defend support and attempt a rebound. If BTC continues lower, pressure on the $0.09 zone will intensify.
Read also: HBAR Is Not a Normal Crypto? Why an Analyst Calls Hedera “Alien Technology”
Bigger Picture for Hedera
Beyond short-term volatility, Hedera’s long-term fundamentals remain intact. The network continues to promote its high throughput, low fees, and enterprise partnerships. But in the current market environment, technical levels are dominating price action.
For now, traders are watching one number: $0.09.
A successful defense could open the door for a move back toward $0.11 and potentially $0.15. A confirmed dip would change focus toward $0.072 and lower liquidity pockets.
With Bitcoin hovering near $65K and market sentiment fragile, the next few daily closes could decide HBAR’s direction for the rest of the week.
Related Articles
MicroStrategy's Bitcoin losses reach $7.9 billion; Saylor: as long as BTC doesn't go to zero, it will head toward a million!
"Bitcoin is dead" search volume hits a record high: Is this a sign of surrender or the true bottom?
Why did Bitcoin plummet today! Trump considers new tariffs, miners liquidate 2000 BTC
Bitcoin spot ETF experiences five consecutive weeks of net outflows, marking the longest outflow since early 2025.