U.S. President Trump delivered a speech on April 2, warning that Iran would suffer a devastating strike within two to three weeks. His tough wording wiped out the gains that had built up in the prior trading day as expectations eased for the U.S.-Iran situation. During the day, Bitcoin hit a low of $65,789, fell by about 4% on the day, saw total liquidations in the crypto market of $440 million, and closed at $67,024. Stocks, gold, and the cryptocurrency markets all moved lower in sync, as overall market risk sentiment contracted across the board.
Easing hopes end overnight: How Trump ignited the market
On April 1, investors were buoyed by reports that the Strait of Hormuz might reopen and that the U.S.-Iran conflict could end quickly, and all three major stock indexes recorded solid gains—S&P 500 rose 0.7%, the Nasdaq rose 1.2%, and the Dow rose 0.5%; the Bitcoin market also benefited in parallel. The market had already fully priced in expectations that the conflict would soon be over.
On April 2, Trump posted on Truth Social and gave a public speech, threatening Iran’s power plants, warning of larger-scale fighting within two to three weeks, and publicly criticizing NATO. The market’s reaction was swift: the Dow closed down about 0.3% to 46,400 points, the S&P 500 closed down about 0.1% to 6,582.68 points, and the Nasdaq fell to around 21,800 points. Tesla dropped more than 5% in a day, dragged down by weak delivery data; Delta, United, American Airlines, and several cruise companies’ shares fell 2% to 4%.
Oil prices, the dollar, and inflation: A triple macro headwind battering Bitcoin
What’s behind Bitcoin’s drop today is that the following three macro variables all deteriorated at the same time:
Oil prices surge: WTI touched $111.50 per barrel intraday (up about 11%), and closed at $103.60; Brent crude touched around $108, and the rapid rise in energy costs intensified inflation expectations
The U.S. dollar strengthens: The U.S. Dollar Index rose about 0.3%, reducing room for the Federal Reserve to cut rates and forming a systemic drag on global risk assets
Safe-haven assets also fall: Gold futures fell nearly 3% to $4,680 per ounce, while silver fell as much as 4% at one point to $6; this suggests the selloff wasn’t simply a rotation out of risk in favor of safe havens, but rather a liquidity contraction led by the strengthening dollar
Historical data shows that the combination of oil prices surging alongside a stronger dollar has significantly narrowed the correlation between Bitcoin and the stock market. The research firm Kobeissi Letter noted that Trump’s series of remarks was “nothing new,” but it was enough to reset the market’s risk-pricing benchmark.
Technicals: RSI turns weaker; $64,000 is the key structural line of defense
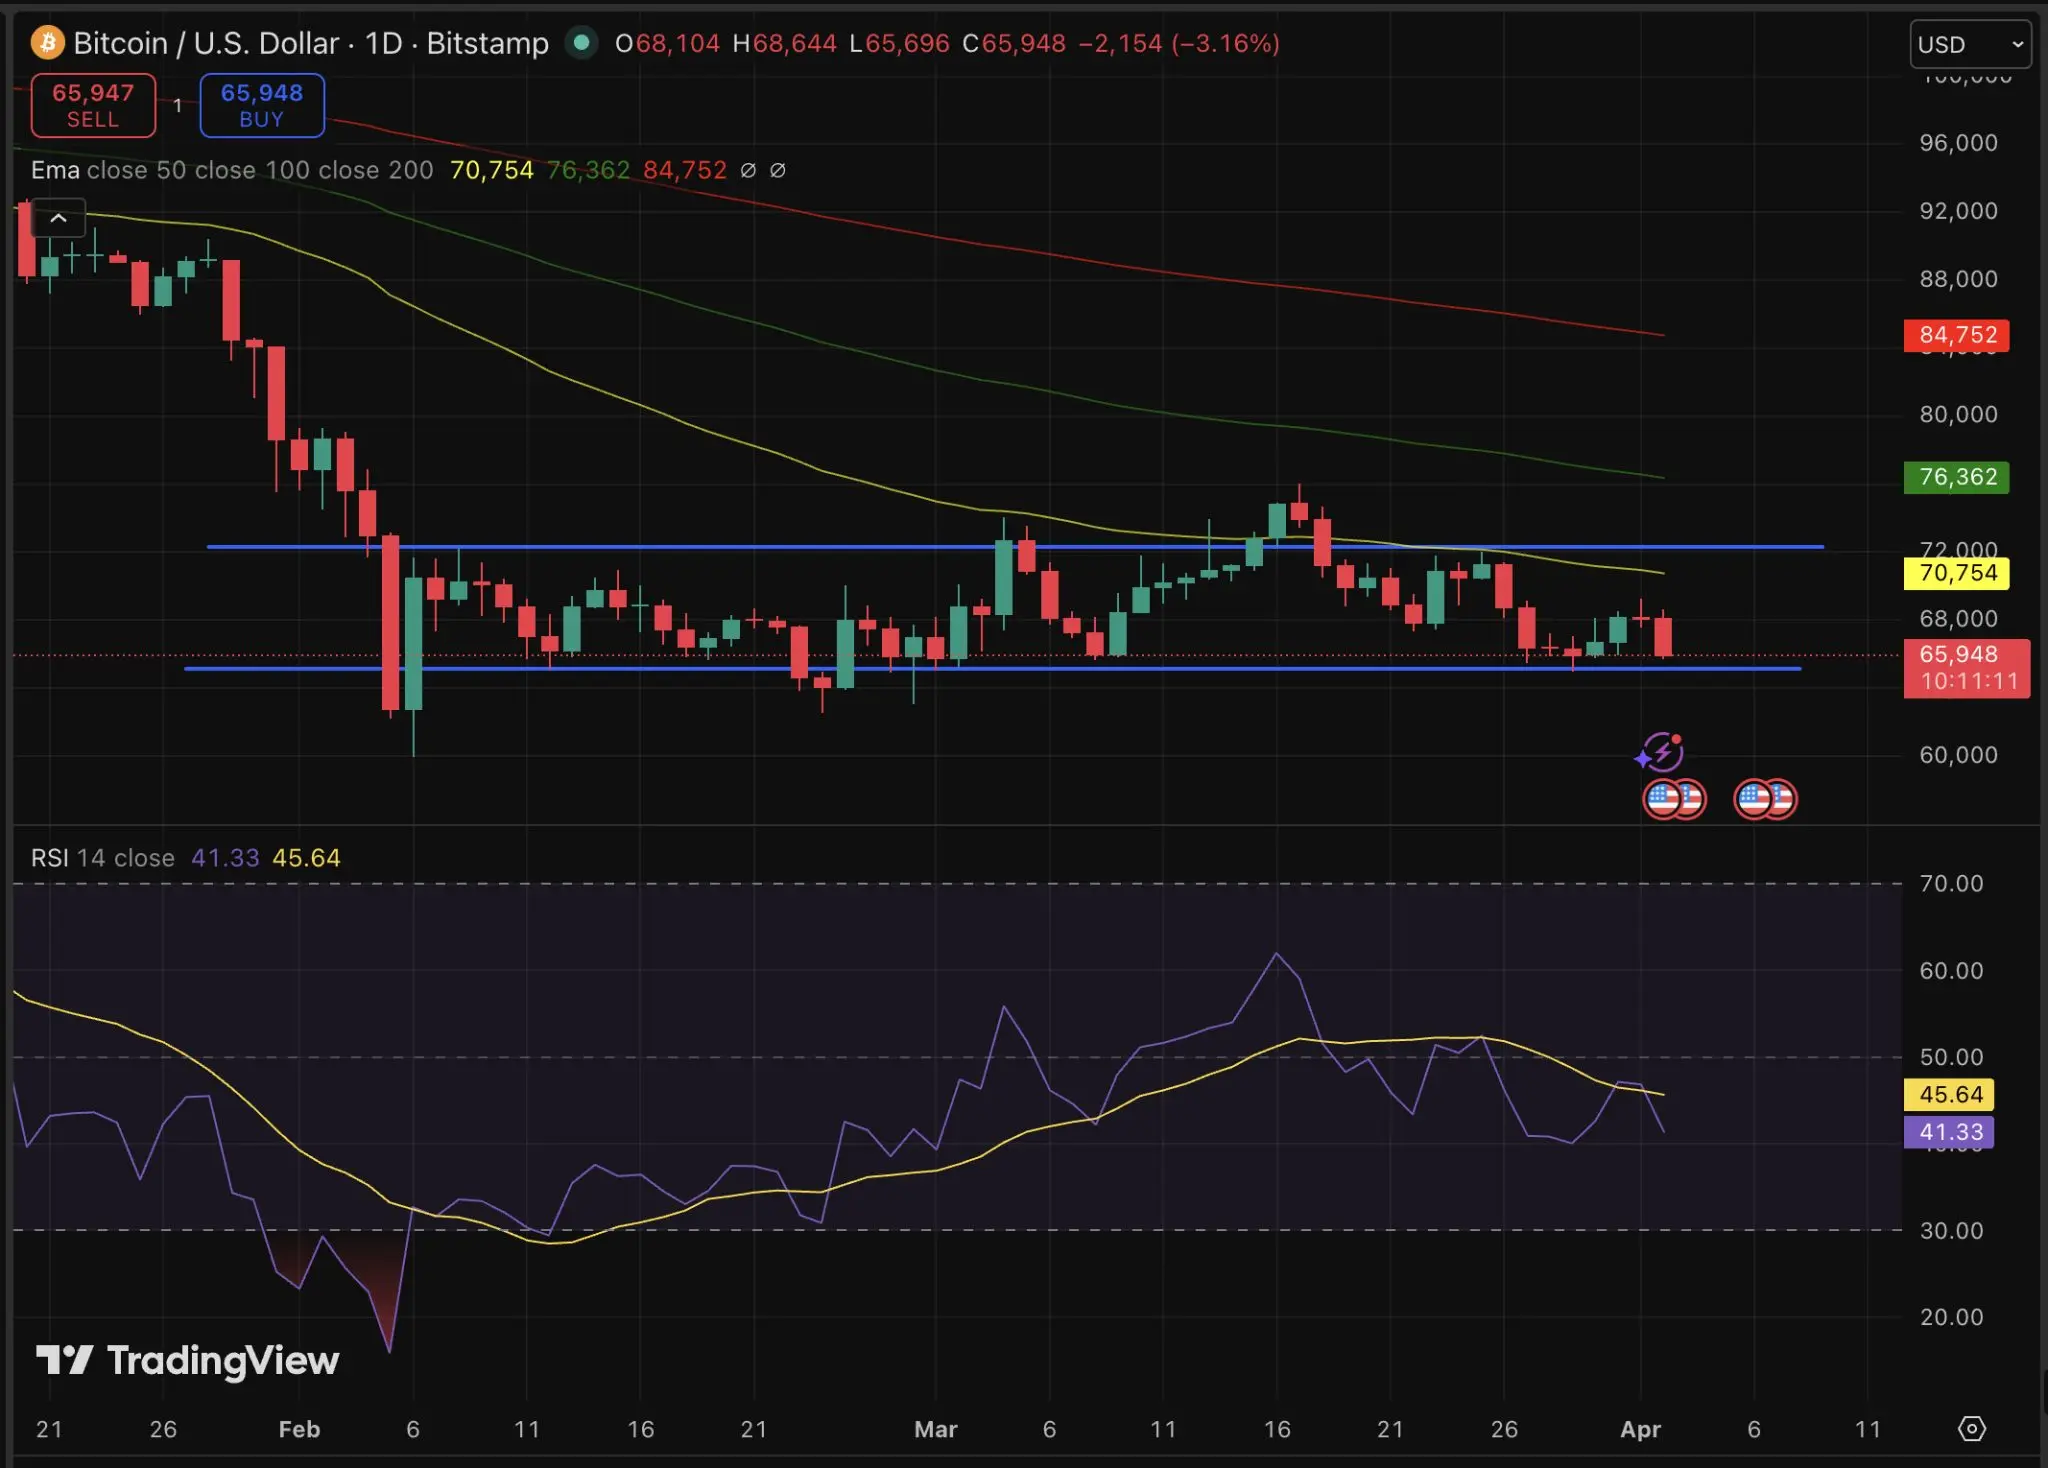 (Source: Trading View)
From a technical perspective, the RSI is currently at 45—neutral on the surface but continuing to decline. The 50-day moving average has narrowed to $70,700; the 200-day moving average is at $84,700. The overall daily chart has turned into a sell signal.
Resistance is concentrated in the $67,000 to $69,000 range. This week, Bitcoin has been blocked there at least once. If current levels can’t be held, the near-term downside targets point to $64,000. Looking longer term, a long-term trendline traced back to 2017 provides the final structural support in this area; if it breaks, Bitcoin’s technical structure would suffer a fundamental deterioration.
Ethereum fell 3% to 4% to about $2,059; Solana and Ripple also weakened in sync. The total market cap of cryptocurrencies fell about 2% to about $2.3 trillion, while Bitcoin dominance remained around 58%.
Frequently asked questions
Why is Bitcoin down today?
The direct trigger for Bitcoin’s decline on April 2 was Trump’s hard warning to Iran, erasing the gains accumulated the previous day amid expectations of easing conditions. Oil prices surged to $111 per barrel, worsening inflation expectations; the strengthening dollar compressed the scope for rate cuts. Together, these formed the macro backdrop for Bitcoin’s drop that day.
Why would a rise in oil prices affect Bitcoin?
A surge in oil prices worsens inflation expectations and reduces market expectations for Federal Reserve rate cuts. Meanwhile, a simultaneous strengthening of the dollar suppresses the overall valuation of risk assets. In such a macro environment, the correlation between Bitcoin and the stock market rises significantly, making Bitcoin one of the assets bearing the brunt when risk appetite contracts.
After Bitcoin breaks below $66,000, where is the next support level?
Technicals indicate that $64,000 is the most critical support level in the near term. Below it is a long-term trendline traced back to 2017. If $64,000 is lost, Bitcoin’s overall technical structure will face a fundamental test.
Disclaimer: The information on this page may come from third parties and does not represent the views or opinions of Gate. The content displayed on this page is for reference only and does not constitute any financial, investment, or legal advice. Gate does not guarantee the accuracy or completeness of the information and shall not be liable for any losses arising from the use of this information. Virtual asset investments carry high risks and are subject to significant price volatility. You may lose all of your invested principal. Please fully understand the relevant risks and make prudent decisions based on your own financial situation and risk tolerance. For details, please refer to
Disclaimer.
