Dogwifhat (WIF), Pudgy Penguins (PENGU), and Artificial Superintelligence Alliance (FET) are leading a strong growth wave in the past 24 hours. This meme and AI token group is expected to continue breaking out as market sentiment tilts positively, amid the Fed’s discussions on possibly lowering interest rates by another 25 basis points.
Dogwifhat faces resistance from the 50-day EMA
Dogwifhat (WIF) is still “stuck” below the 50-day EMA at $0.450, continuing to struggle with resistance connecting the two peaks on October 13 and 29 on the daily logarithmic chart. At the time of writing, WIF is down nearly 1% on Wednesday, after a strong 12% jump in the previous session.
If the bulls succeed in pushing the price above $0.450, the recovery could extend toward $0.619 — the high set on October 13.
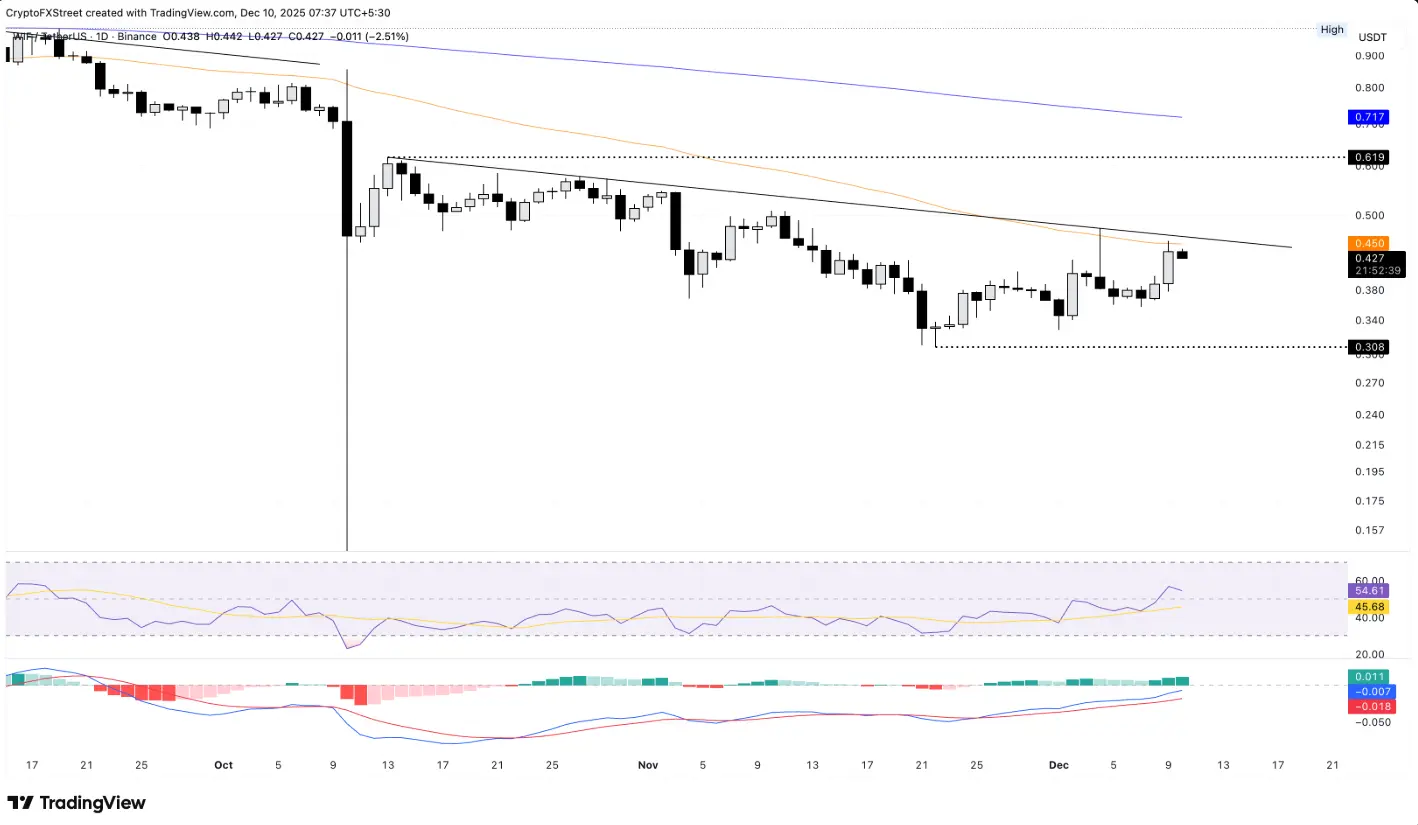 Daily WIF/USDT chart | Source: TradingView Technical signals on the daily timeframe also indicate bullish momentum is gradually taking over. The RSI stands at 54, maintaining above the neutral level and still having room to grow before reaching overbought territory.
Meanwhile, the MACD continues to strengthen its bullish trend as the two moving averages approach close to zero, accompanied by expanding dark green histogram bars.
However, in the scenario where the price is rejected at the $0.450 zone, WIF could reverse downward to test the November 22 bottom around $0.308.
Pudgy Penguins continues its breakout momentum
Pudgy Penguins registered a slight 1% decrease on Wednesday, after a remarkable 10% breakout the previous day. This meme coin is now approaching the 50-day EMA at $0.01485, right after successfully breaking out of the descending channel pattern on the daily logarithmic chart.
Above this price zone, the November 11 high at $0.01665 and the 200-day EMA at $0.02064 could form key resistance levels.
 Daily PENGU/USDT chart | Source: TradingView The RSI indicator is oscillating around 50 on the daily timeframe, reflecting a recovery back to a balanced state after a period of strong selling pressure. Additionally, the MACD line and the MACD signal line continue to lean toward an uptrend, reinforcing upward momentum after breaking out of the downtrend channel.
On the support side, the psychological level of $0.01000 remains a critical buffer zone for the price trend.
Artificial Superintelligence Alliance aims to break out of the downtrend channel
Artificial Superintelligence Alliance (FET) is trading around $0.2600 on Wednesday, following nearly 10% gains in the previous session. This AI token is striving to break above the resistance of the downtrend channel at $0.2650.
If the closing price decisively breaks above this level, a breakout signal will be confirmed, opening opportunities for a rally toward the 50-day EMA at $0.2977, and further toward the 200-day EMA around $0.5144.
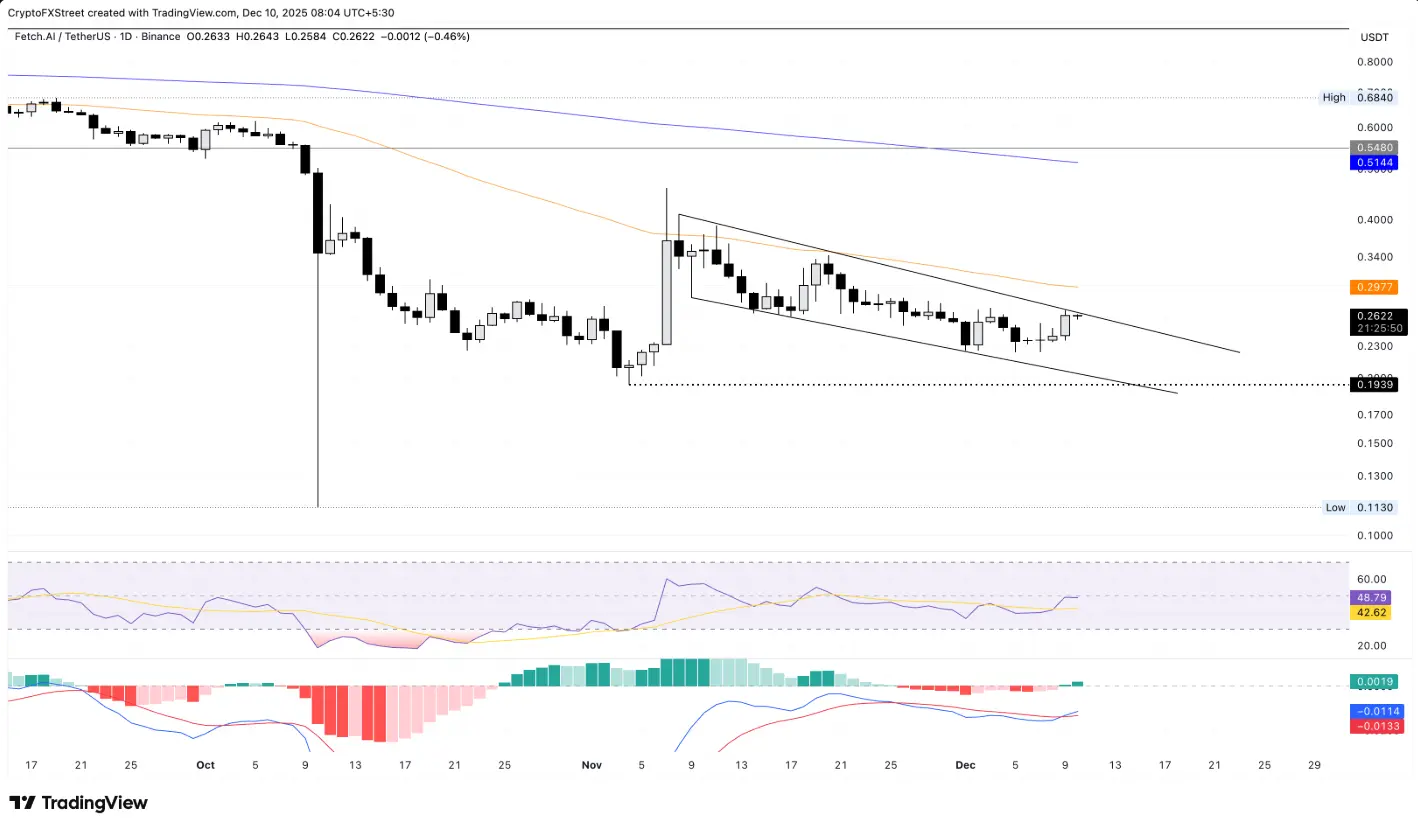 Daily FET/USDT chart | Source: TradingView On the daily chart, the MACD indicator shows a bullish crossover as the (green) MACD line crosses above the (red) signal line, accompanied by the appearance of new green histogram bars. Meanwhile, the RSI stands at 48, oscillating near the neutral zone — indicating the market is not strongly tilted toward either buyers or sellers.
However, if FET fails at the $0.2650 resistance and reverses downward, the price could continue declining along the downtrend channel, returning to test the lower edge near the $0.2000 zone.
SN_Nour
Disclaimer: The information on this page may come from third parties and does not represent the views or opinions of Gate. The content displayed on this page is for reference only and does not constitute any financial, investment, or legal advice. Gate does not guarantee the accuracy or completeness of the information and shall not be liable for any losses arising from the use of this information. Virtual asset investments carry high risks and are subject to significant price volatility. You may lose all of your invested principal. Please fully understand the relevant risks and make prudent decisions based on your own financial situation and risk tolerance. For details, please refer to
Disclaimer.
Related Articles
Ethereum Activity at All-Time Highs Due to Mass Capitulation - U.Today
Ethereum's network shows high activity, surpassing 2021 metrics, but this surge is due to investors selling rather than genuine demand. Liquidity is declining as users withdraw capital to exchanges, signaling potential challenges ahead.
UToday1h ago
Dogecoin Tests $0.090 Support After 3.4% Drop as Traders Watch Key Price Range
Dogecoin is currently trading at $0.09061 which is a drop of 3.4 percent, and the price is close to the important level of $0.09011 support.
The chart indicates a series of tests of the support zone of $0.089-$0.090, and the closest resistance is represented by $0.09353.
A hold of
CryptoNewsLand3h ago
PEPE Price at $0.053259 as Tight Range and Falling Volume Shape Short-Term Market Activity
PEPE was traded at $0.053259 and has recorded a 3.0 percent fall in value but it is within a thin band of support and resistance.
The market exhibited a volume of 235.15M in 24 hour trading, which is a decline of 19.16% reflecting less trading activity.
Technical indicators are not
CryptoNewsLand3h ago
XRP ETF Performance Praised as 'Really Impressive' by Bloomberg - U.Today
XRP ETFs have shown resilience amid a 45% price drop, attracting significant capital despite typical market behavior. Bloomberg's Eric Balchunas highlights strong investor support. Despite recent outflows, the funds retain substantial assets, indicating community dedication.
UToday3h ago
Crypto Shines Amid Middle East Oil Shock and Market Selloff
Bitcoin remains stable amid market turmoil fueled by rising oil prices and inflation, outperforming traditional assets. Its reduced leverage limits forced selling, attracting long-term investors eyeing potential gains in a volatile landscape.
CryptoFrontNews3h ago
XRP Holds $1.34 Support While Leverage Heatmap Highlights $1.30 Risk Zone
XRP is trading at $1.36 in a tight range of support at $1.34 and resistance at $1.37.
The heatmap data indicates that there is a huge amount of long positions in the range of $1.30.
Should prices fall to around $1.30, long positions with high leverage in this region might
CryptoNewsLand4h ago