Litecoin (LTC) price is experiencing a slight recovery, currently trading above the $68 mark on Tuesday morning. After touching the support zone around the bottom of the descending wedge pattern, LTC seems to have found a solid resistance. On-chain signals combined with improving derivatives data indicate that this coin has prospects for a rebound if buyers continue to successfully defend the key support area.
On-chain and derivatives data for Litecoin show recovery potential
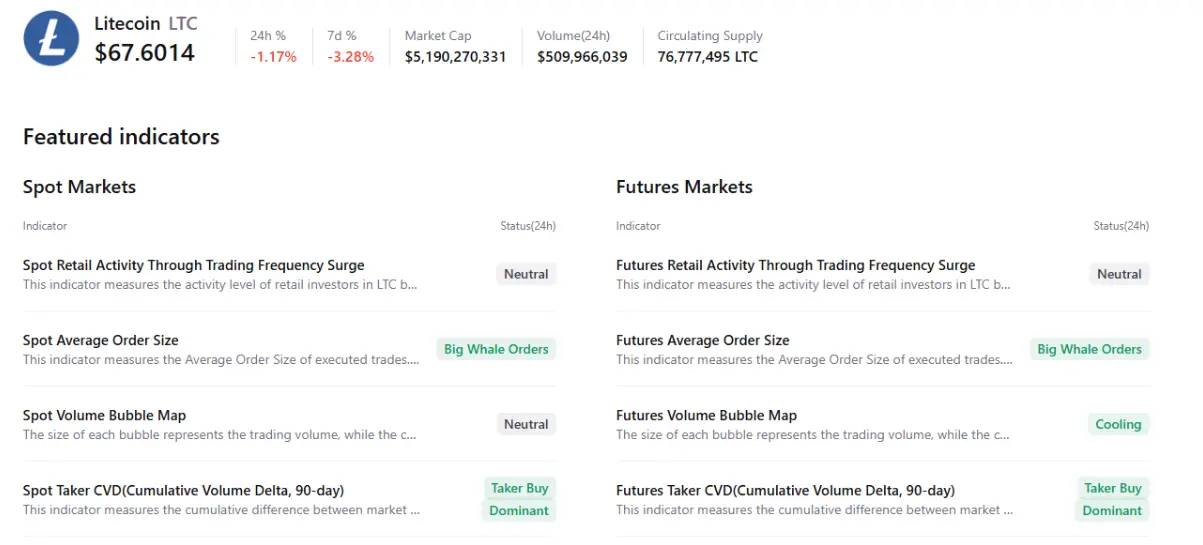
The aggregated chart from CryptoQuant presents a positive outlook for Litecoin, as both the Spot and Futures markets show large orders from whales, with clear buying pressure dominating. Meanwhile, the Futures market is showing signs of cooling down, creating a favorable foundation for a potential recovery.
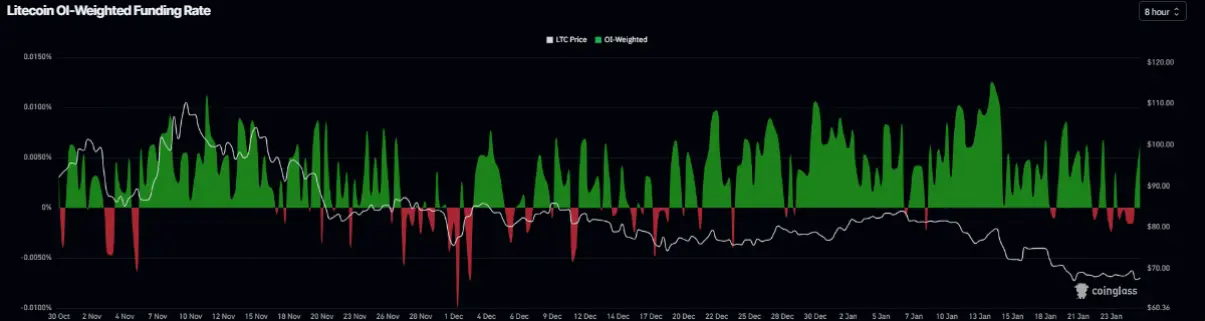
 Source: CryptoQuant OI-Weighted Funding Rate data from CoinGlass also supports this outlook: the number of traders betting on further price declines remains lower than those expecting increases. This index turned positive on Sunday and is currently at 0.0063%, indicating that Long positions are paying fees to Shorts. Based on market experience, when the funding rate shifts from negative to positive, Litecoin often shows clear signs of recovery.
 Source: CoinGlass## Litecoin Price Forecast: LTC could recover if key support holds
On January 14, Litecoin (LTC) was rejected at the 50-day EMA at $77.39 and then declined nearly 18% over the next 10 days, retesting the April 9 low of $66.51 last week. In the past four days, LTC has been moving sideways around the lower boundary of the descending wedge pattern, connecting multiple highs and lows since mid-October. As of Monday, LTC is trading around $68.14.
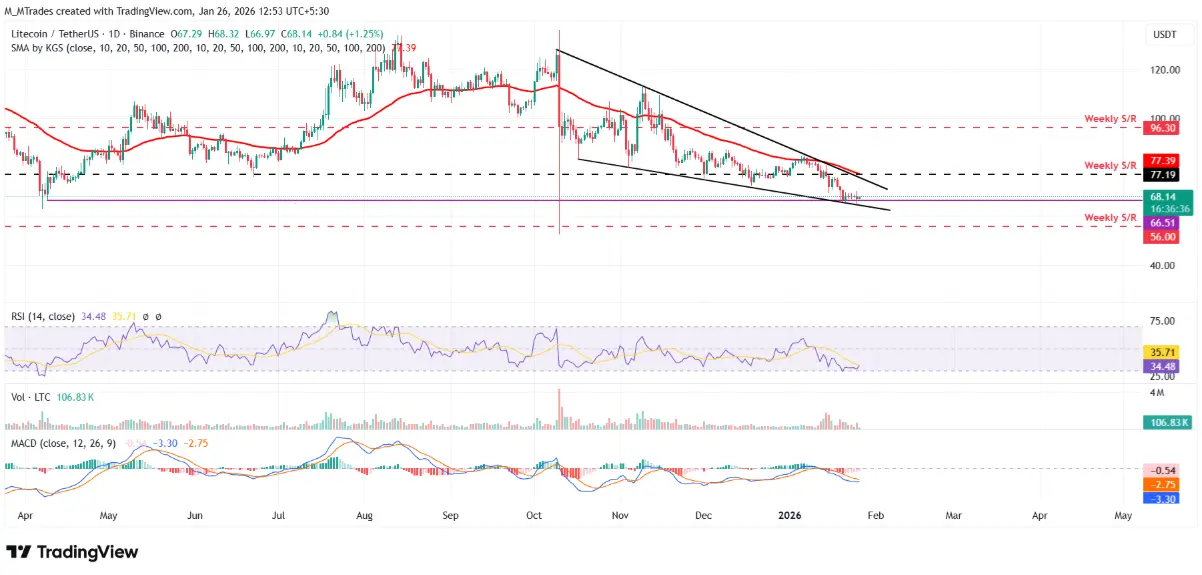 Daily LTC/USDT chart | Source: TradingView If the lower trendline is maintained as support, LTC could continue its recovery toward the weekly resistance at $77.19, close to the 50-day EMA at $77.39. The daily RSI is at 34 and trending upward after reaching oversold territory, indicating selling pressure is weakening and early signs of recovery are emerging. However, for a solid rebound, the RSI needs to break above the neutral level of 50. Meanwhile, the MACD is converging with shrinking red histograms below zero, further strengthening LTC’s potential to bounce back.
Conversely, if LTC faces selling pressure, the next weekly support zone is expected around $56.
Disclaimer: The information on this page may come from third parties and does not represent the views or opinions of Gate. The content displayed on this page is for reference only and does not constitute any financial, investment, or legal advice. Gate does not guarantee the accuracy or completeness of the information and shall not be liable for any losses arising from the use of this information. Virtual asset investments carry high risks and are subject to significant price volatility. You may lose all of your invested principal. Please fully understand the relevant risks and make prudent decisions based on your own financial situation and risk tolerance. For details, please refer to
Disclaimer.
Related Articles
SHIB Nears Breakout Point After Revisiting Powerful Support Level
SHIB revisits a key support zone that previously triggered major price rallies.
Price compression and accumulation signals suggest a potential breakout ahead.
Analysts project strong upside, though market conditions may limit extreme gains.
Shiba Inu has returned to a price level that on
CryptoNewsLand1h ago
PEPE Price Outlook: The Case for a Surprise ‘Disbelief Rally’ Ahead
PEPE shows weak sentiment with falling price, volume, and Open Interest.
Heavy short bias may trigger a surprise rally through liquidation clusters.
Range-bound price suggests a possible trap before continuation of bearish trend.
PepeCoin — PEPE, has taken another hit, and sentiment
CryptoNewsLand2h ago
Crypto Fear and Greed Index Drops to 30, Signals Panic State
Gate News message, April 25 — The Crypto Fear and Greed Index currently stands at 30, down 8 points from yesterday, according to Coinglass data. The seven-day average is 33, while the 30-day average is 18, indicating a shift toward panic sentiment in the
GateNews4h ago
Not Too Late Yet: Altcoins Eye Rapid Move Ahead of Economic Uncertainty — 5 Picks Investors Are Watching
Market rotation is splitting attention between meme coins and infrastructure-driven blockchain projects.
TAO and FIL reflect stronger alignment with emerging tech and data infrastructure narratives.
DOGE and SHIB remain primarily driven by retail sentiment and short-term volatility
CryptoNewsLand7h ago
Bitcoin Quantum Computing Threat Is Manageable, Real Issue Is Governance: Analyst
Gate News message, April 25 — Bitcoin analyst James Check said quantum computing poses a "manageable risk" rather than a systemic threat to Bitcoin, according to CoinDesk. Approximately 1.7 million BTC are held in Satoshi-era addresses, which could face risk if quantum computing breaks elliptic
GateNews7h ago
Positioned or Left Behind? Altcoins Show Pre-Breakout Momentum with 150%+ Upside — 5 Coins Worth Buying Today
Liquidity is rotating selectively into both DeFi and infrastructure tokens.
Meme assets show higher volatility compared to utility-driven protocols.
Market conditions resemble early-stage accumulation before potential expansion phases.
Market participants are observing renewed accumulati
CryptoNewsLand9h ago