Solana (SOL) consolidates below the key resistance zone, and the flow of funds signals a bullish trend.
Solana (SOL) is fluctuating around the $85 mark as of writing on Tuesday, after multiple attempts but still unable to break out of the accumulation zone above. A decisive break from this area could serve as a catalyst, opening the way for a new upward trend for SOL. Notably, demand from institutional investors is showing signs of returning as spot ETF funds recorded a net inflow of over $13 million last week. From a technical perspective, momentum indicators are gradually improving, reinforcing the recovery outlook for SOL in the upcoming trading sessions.
Institutional Demand for SOL Returns
Demand from institutions for Solana is sending encouraging early signals of recovery. According to data from SoSoValue, spot ETFs saw inflows of $13.17 million last week, officially ending a two-week outflow streak since late January. If this capital inflow continues and increases, Solana’s price is likely to enter a clear recovery phase.
Beyond just capital flows, several other optimistic signals are supporting the price recovery scenario. Last weekend, Solana shared on X notable developments within its ecosystem: Citi digitized a promissory note as a token and deployed the entire lifecycle—from issuance to settlement—directly on the Solana blockchain. Meanwhile, Goldman Sachs announced it holds $108 million worth of SOL. Even more noteworthy, the total value locked (TVL) in the real-world assets (RWA) segment on Solana reached an all-time high of $1.66 billion, with over 285,000 unique addresses holding assets—an indication of increasing appeal of this network to both institutions and long-term investors.
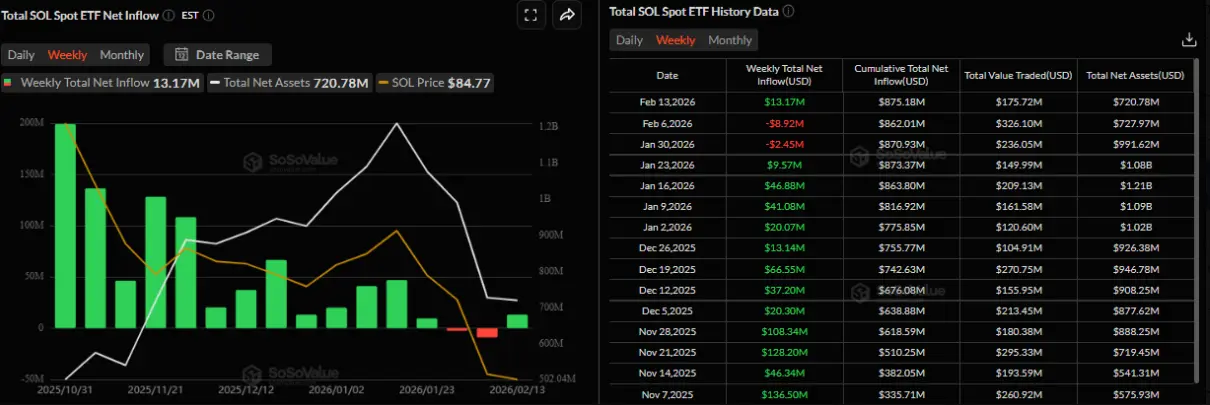 Weekly net fund flow chart into SOL spot ETF | Source: SoSoValue## Solana Price Forecast: SOL Could Extend Recovery if It Breaks Out of the Accumulation Zone
The price of Solana found solid support around the lower boundary of the accumulation zone at $76.45 on Thursday. From there, buying pressure helped the price recover over two consecutive sessions, testing the upper boundary of the accumulation zone at $89.38 before weakening and pulling back on Sunday. As of Tuesday, SOL is trading around the $85 mark.
In a positive scenario, if SOL breaks out and closes firmly above the upper boundary of the accumulation zone, the upward momentum could be extended toward the important psychological level of $100.
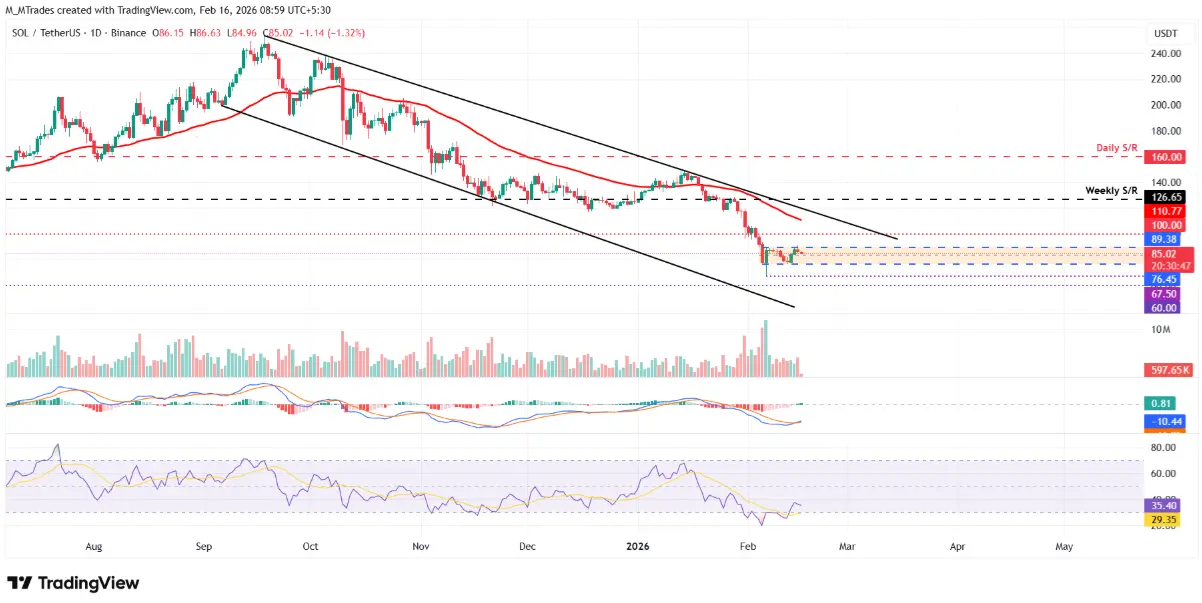 Daily SOL/USDT chart | Source: TradingView Technical indicators are also signaling support for a recovery. The relative strength index (RSI) on the daily timeframe is currently at 35 and has rebounded from the oversold region, indicating selling pressure is gradually weakening. At the same time, the MACD indicator recorded a bullish crossover on Sunday, further strengthening the short-term reversal outlook.
Conversely, if SOL fails to hold the support zone and closes below $76.45, the risk of a deeper decline increases, with the next target being the February 6 low at $67.50.
SN_Nour
Related Articles
Ju.com completes the third phase of the SOL 20% discount Launchpad event, and the fourth phase XRP is scheduled to launch on February 19.
Data: US SOL spot ETF's total net inflow for the day is $2,193,800
Zora launches "attention markets" on Solana
Two Price Zones That Could Decide Solana’s Next Big Move