Finding the "golden key" for prediction markets through 27.73 million transaction data points, yet 690 K-line strategies struggle to turn a profit
Author: Frank, PANews
How difficult is it to find a profitable “golden key” in prediction markets?
On social media, you often see people claiming they’ve discovered a clever money-making secret, but in reality, it’s often empty talk. What people can see are only the profit curves of these smart funds’ growth, not the underlying logic.
How exactly can one build a personalized trading strategy that is applicable to prediction markets?
Taking the BTC 15-minute prediction market as an example, PANews analyzed nearly 27.73 million trades across 3,082 windows over the past month and arrived at some conclusions that may challenge conventional understanding. In previous articles, we already examined the macro data of this market. This time, we will delve deeper into the details to find that possible “golden key.”
Illusion Shattered: The Complete Failure of K-line Technical Analysis
Have you ever considered a strategy where you treat the prediction market like stock or crypto trading, analyzing entry and exit points purely based on price movements, combined with position management, take-profit, and stop-loss, to develop a trading approach that is completely independent of BTC’s market trend and only considers prediction market price changes?
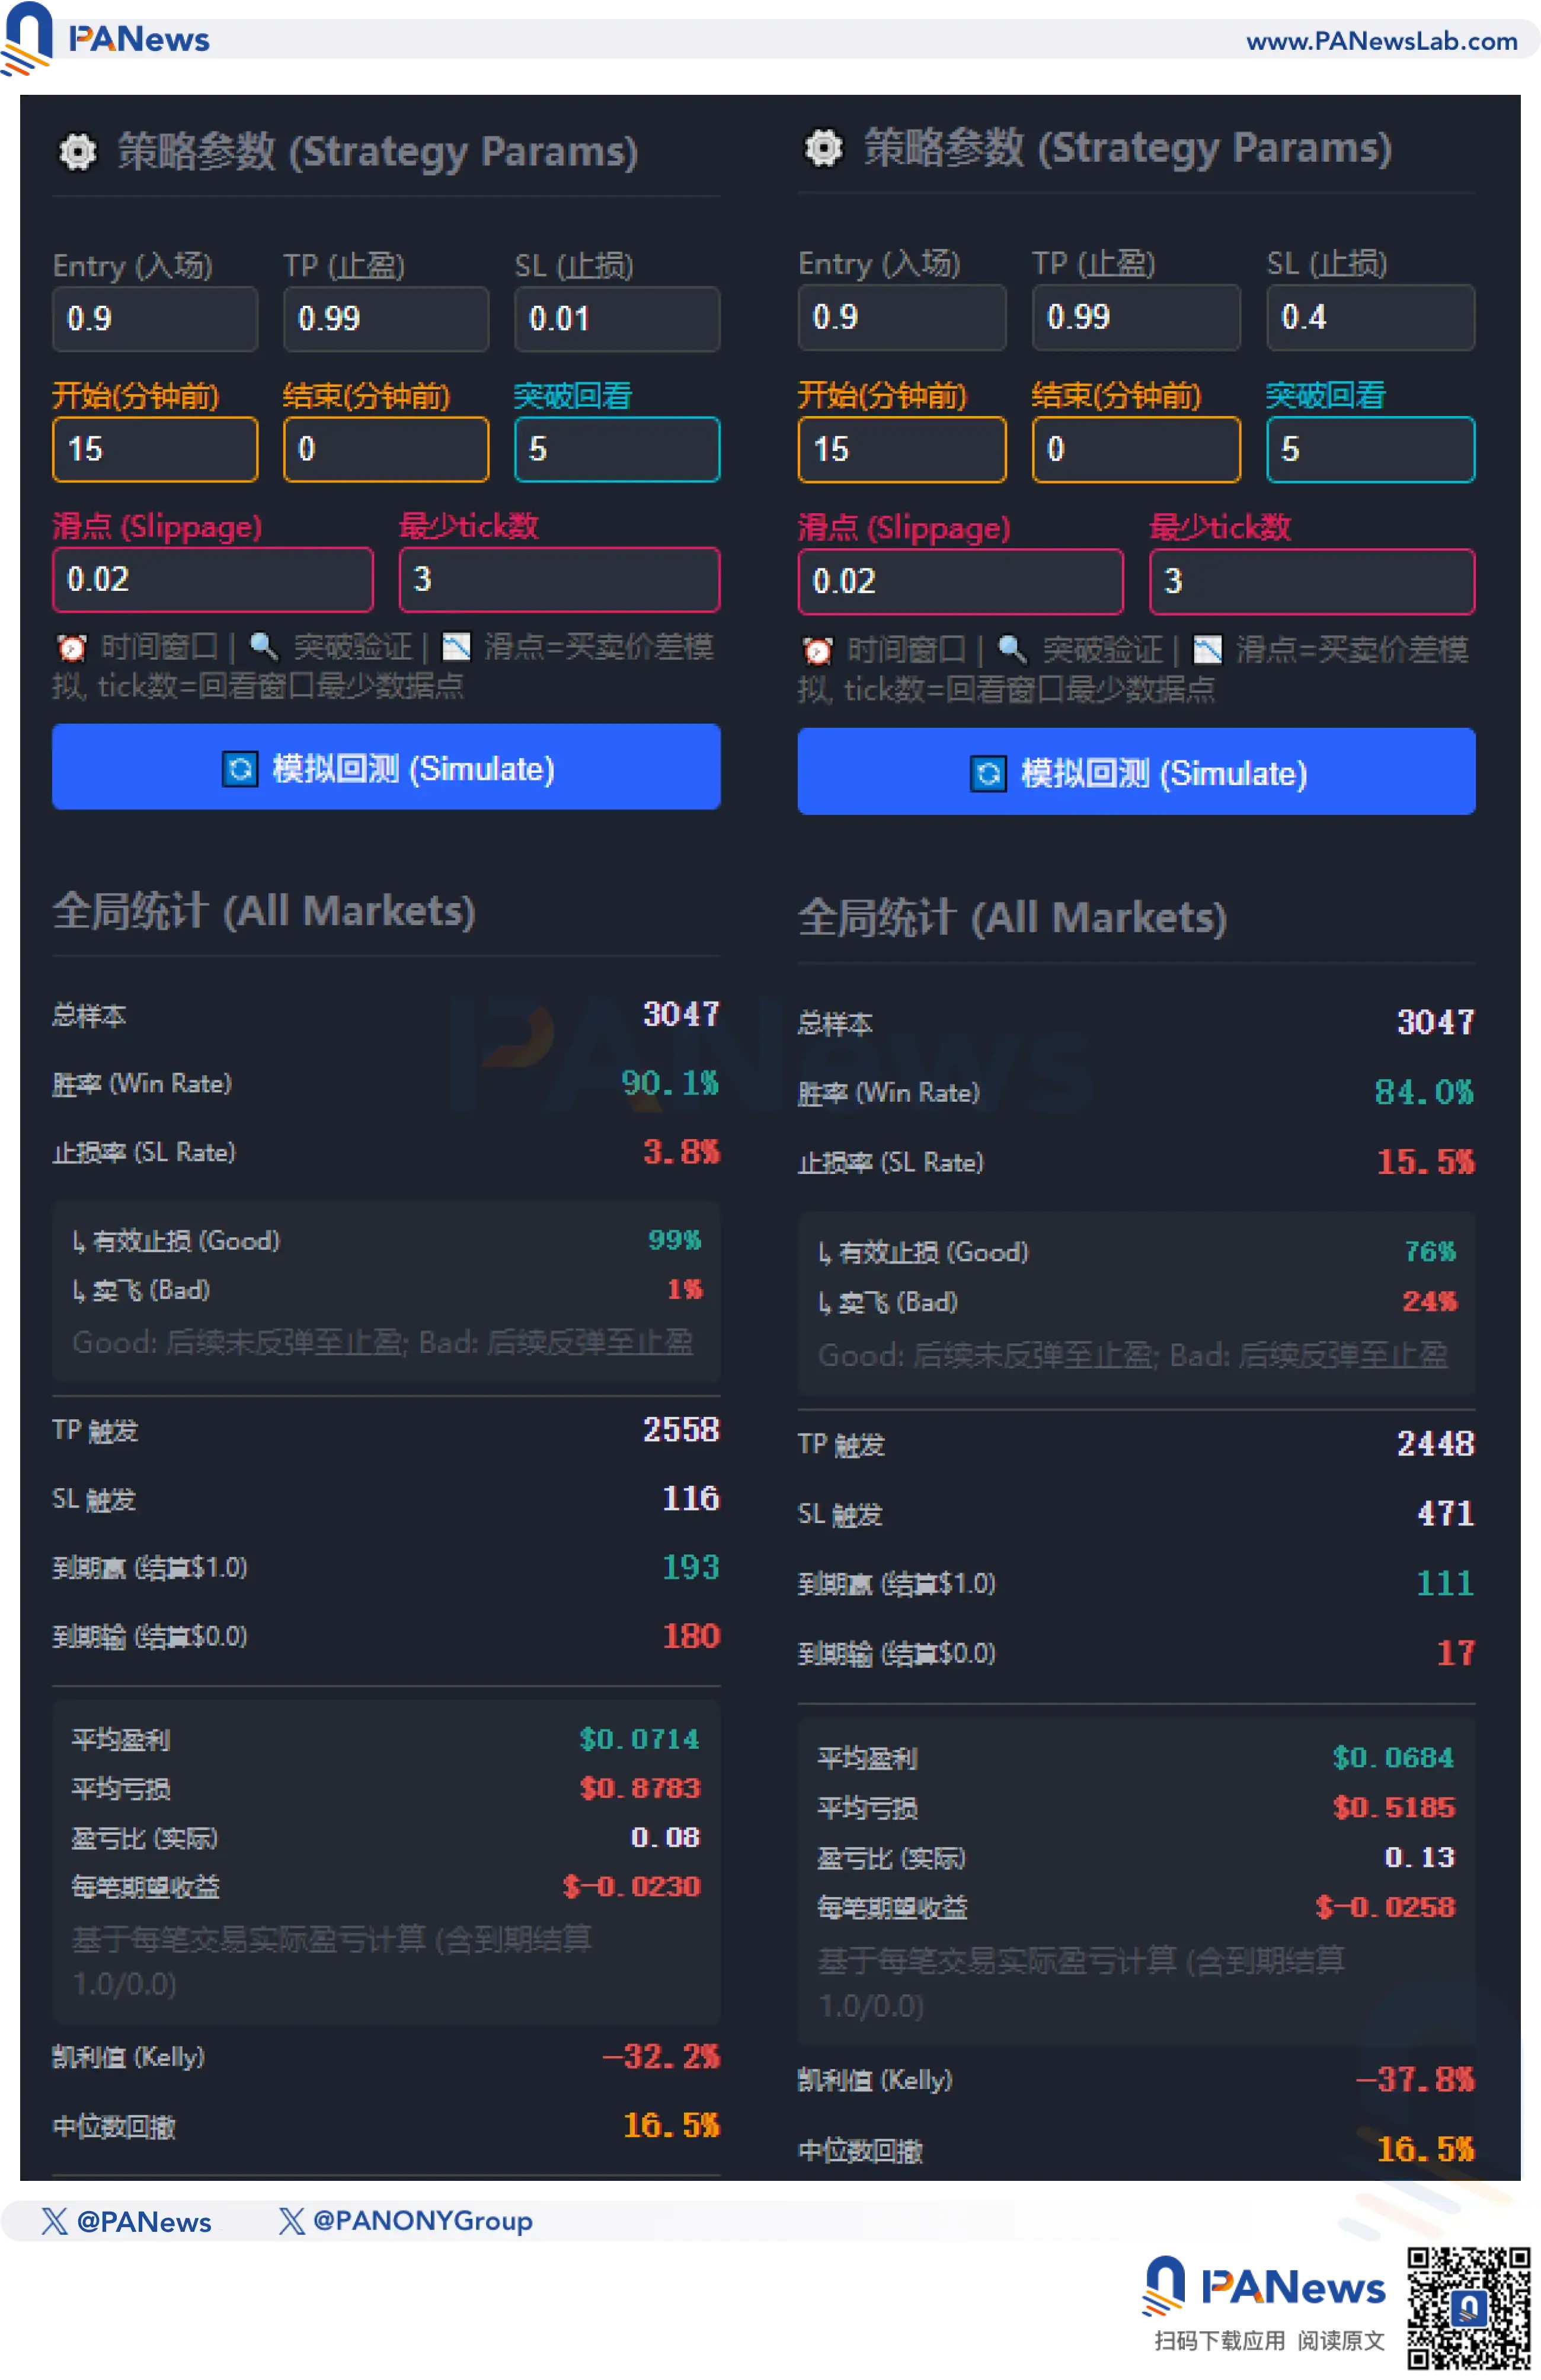
In traditional crypto markets, this approach is known as “technical analysis.” Theoretically, this framework should work equally well in prediction markets. Therefore, PANews simulated this approach and developed a custom backtesting system for prediction markets. This system allows inputting various factors such as entry points, take-profit and stop-loss levels, entry timing, and noise exclusion to evaluate the actual profit/loss ratio and win rate based on over 3,000 market data points from the past 30 days.
Initially, with incomplete data (Polymarket’s historical data provides only 3,500 entries per market), the backtest results could easily find profitable strategies—such as entering at 60% of the price, selling at 90%, stopping loss at 40%, and trading within a certain window.
However, the real-world results diverged sharply. Under actual execution, the profit curve showed a slow, dull decline, like a dull knife cutting meat. We then attempted to supplement the data as much as possible, trying multiple solutions, and finally obtained complete price information for all markets. This time, the results began to align with reality.
In real data testing, PANews simulated 690 combinations of price, take-profit, stop-loss, entry timing, noise filtering, and slippage. The final conclusion was that no strategy could achieve a positive expected return.
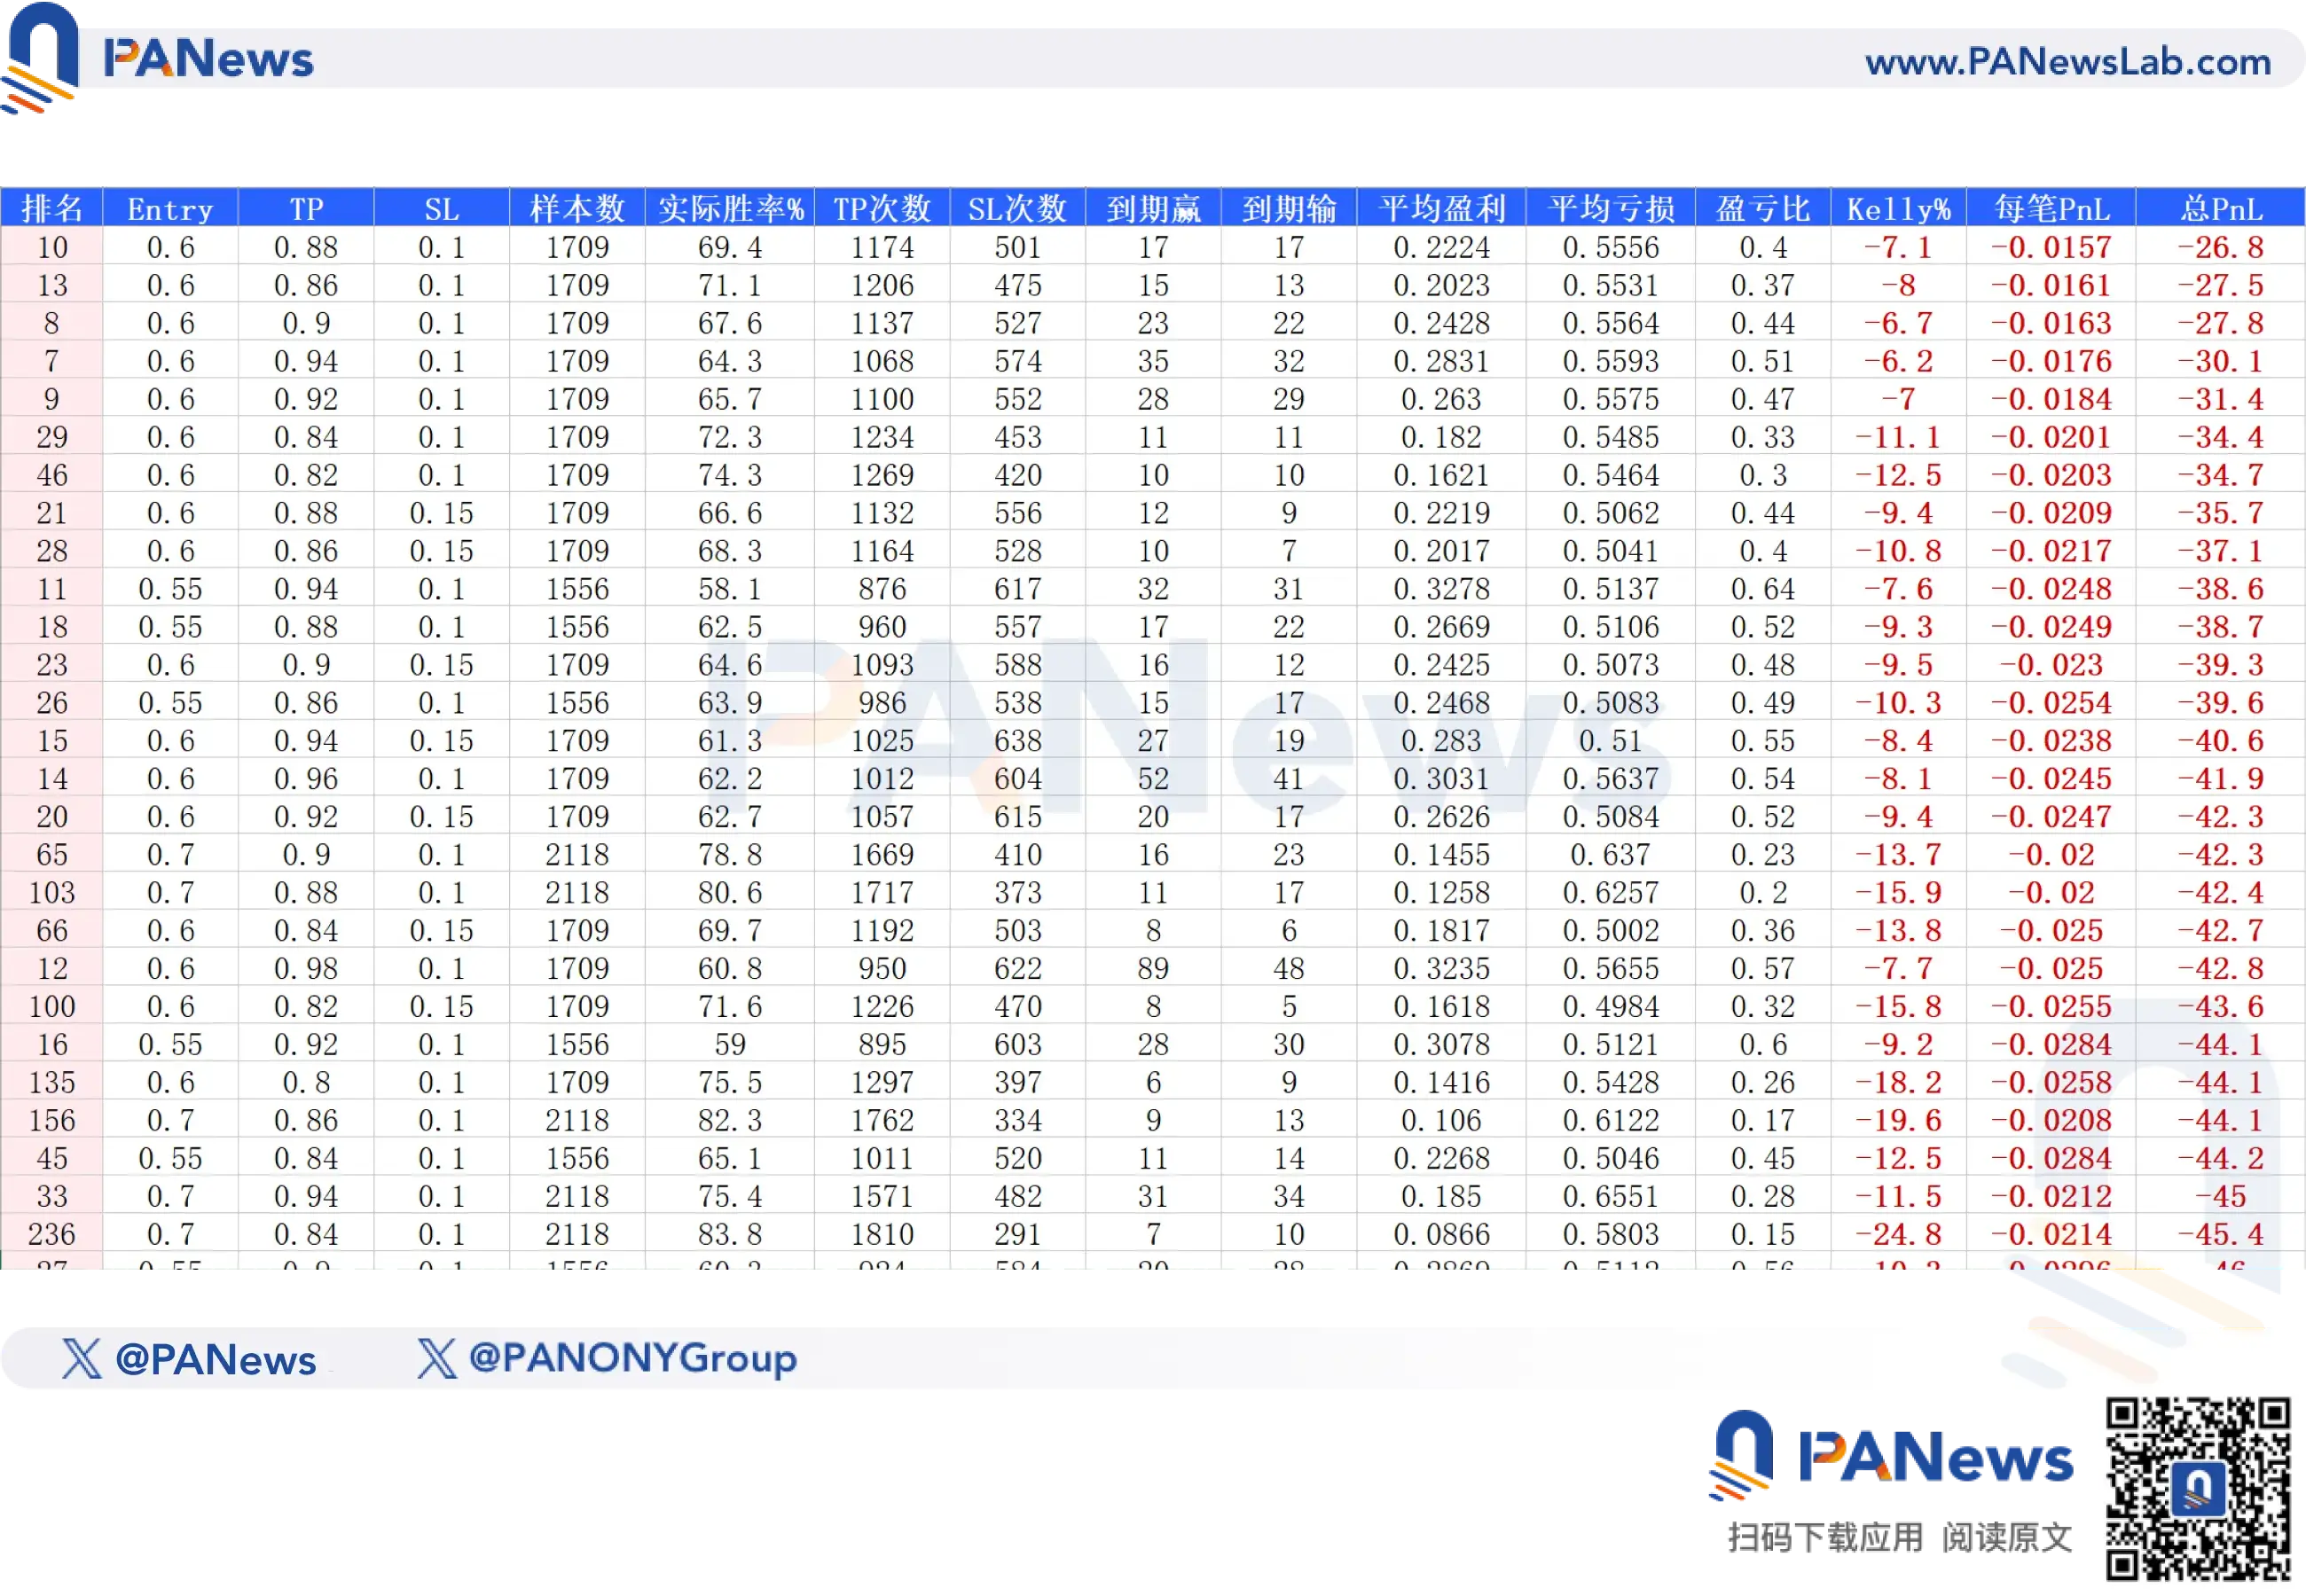
Even the most profitable one had an expected return of -26.8%. This indicates that, in prediction markets, all pure mathematical forecasts that exclude event-specific factors are almost impossible to profit from.
For example, the widely discussed “end-of-day strategy” on social media—buy at 90%, sell at 99%—seems to have a very high win rate and looks profitable in the long run. In our simulations, this strategy achieved a win rate of 90.1%, with 2,558 out of 3,047 trades hitting take-profit. But alarmingly, the actual profit/loss ratio was only 0.08, and the expected value calculated via the Kelly criterion was -32.2%, making it not worth adopting.
Some might ask whether adding a stop-loss could improve the risk-reward ratio. The harsh reality is that increasing the reward-to-risk ratio often reduces the win rate. For example, setting a 40% stop-loss drops the win rate to 84%, and combined with a still-low reward-to-risk ratio, the Kelly expected value remains at -37.8%, still a loss.
The most promising approach appears to be a “reversal bet”: buying at 1% below the current price, betting that the market will reverse and win. In simulations, this approach has a win rate of about 1.1%, higher than the probability implied by the price, and an extremely high profit-to-loss ratio of 94, leading to an expected return of 0.0004. But this assumes no slippage or fees; once transaction costs are included, the expected value turns negative instantly.
In summary, our research shows that relying solely on technical analysis from traditional finance in prediction markets cannot generate profits.
The Trap of “Two-way Arbitrage”
Besides these strategies, a mainstream view is that two-way arbitrage—where as long as the total cost of YES + NO is below 1—can always be profitable. This is an idealistic notion, but reality is often less forgiving.
First, with cross-platform arbitrage, many bots are already operating. Ordinary users cannot compete with these liquidity-providing bots for scarce liquidity.
Another approach is, for example, buying when the YES price drops to 40% and the NO price also drops to 40%, creating a 20% arbitrage window.
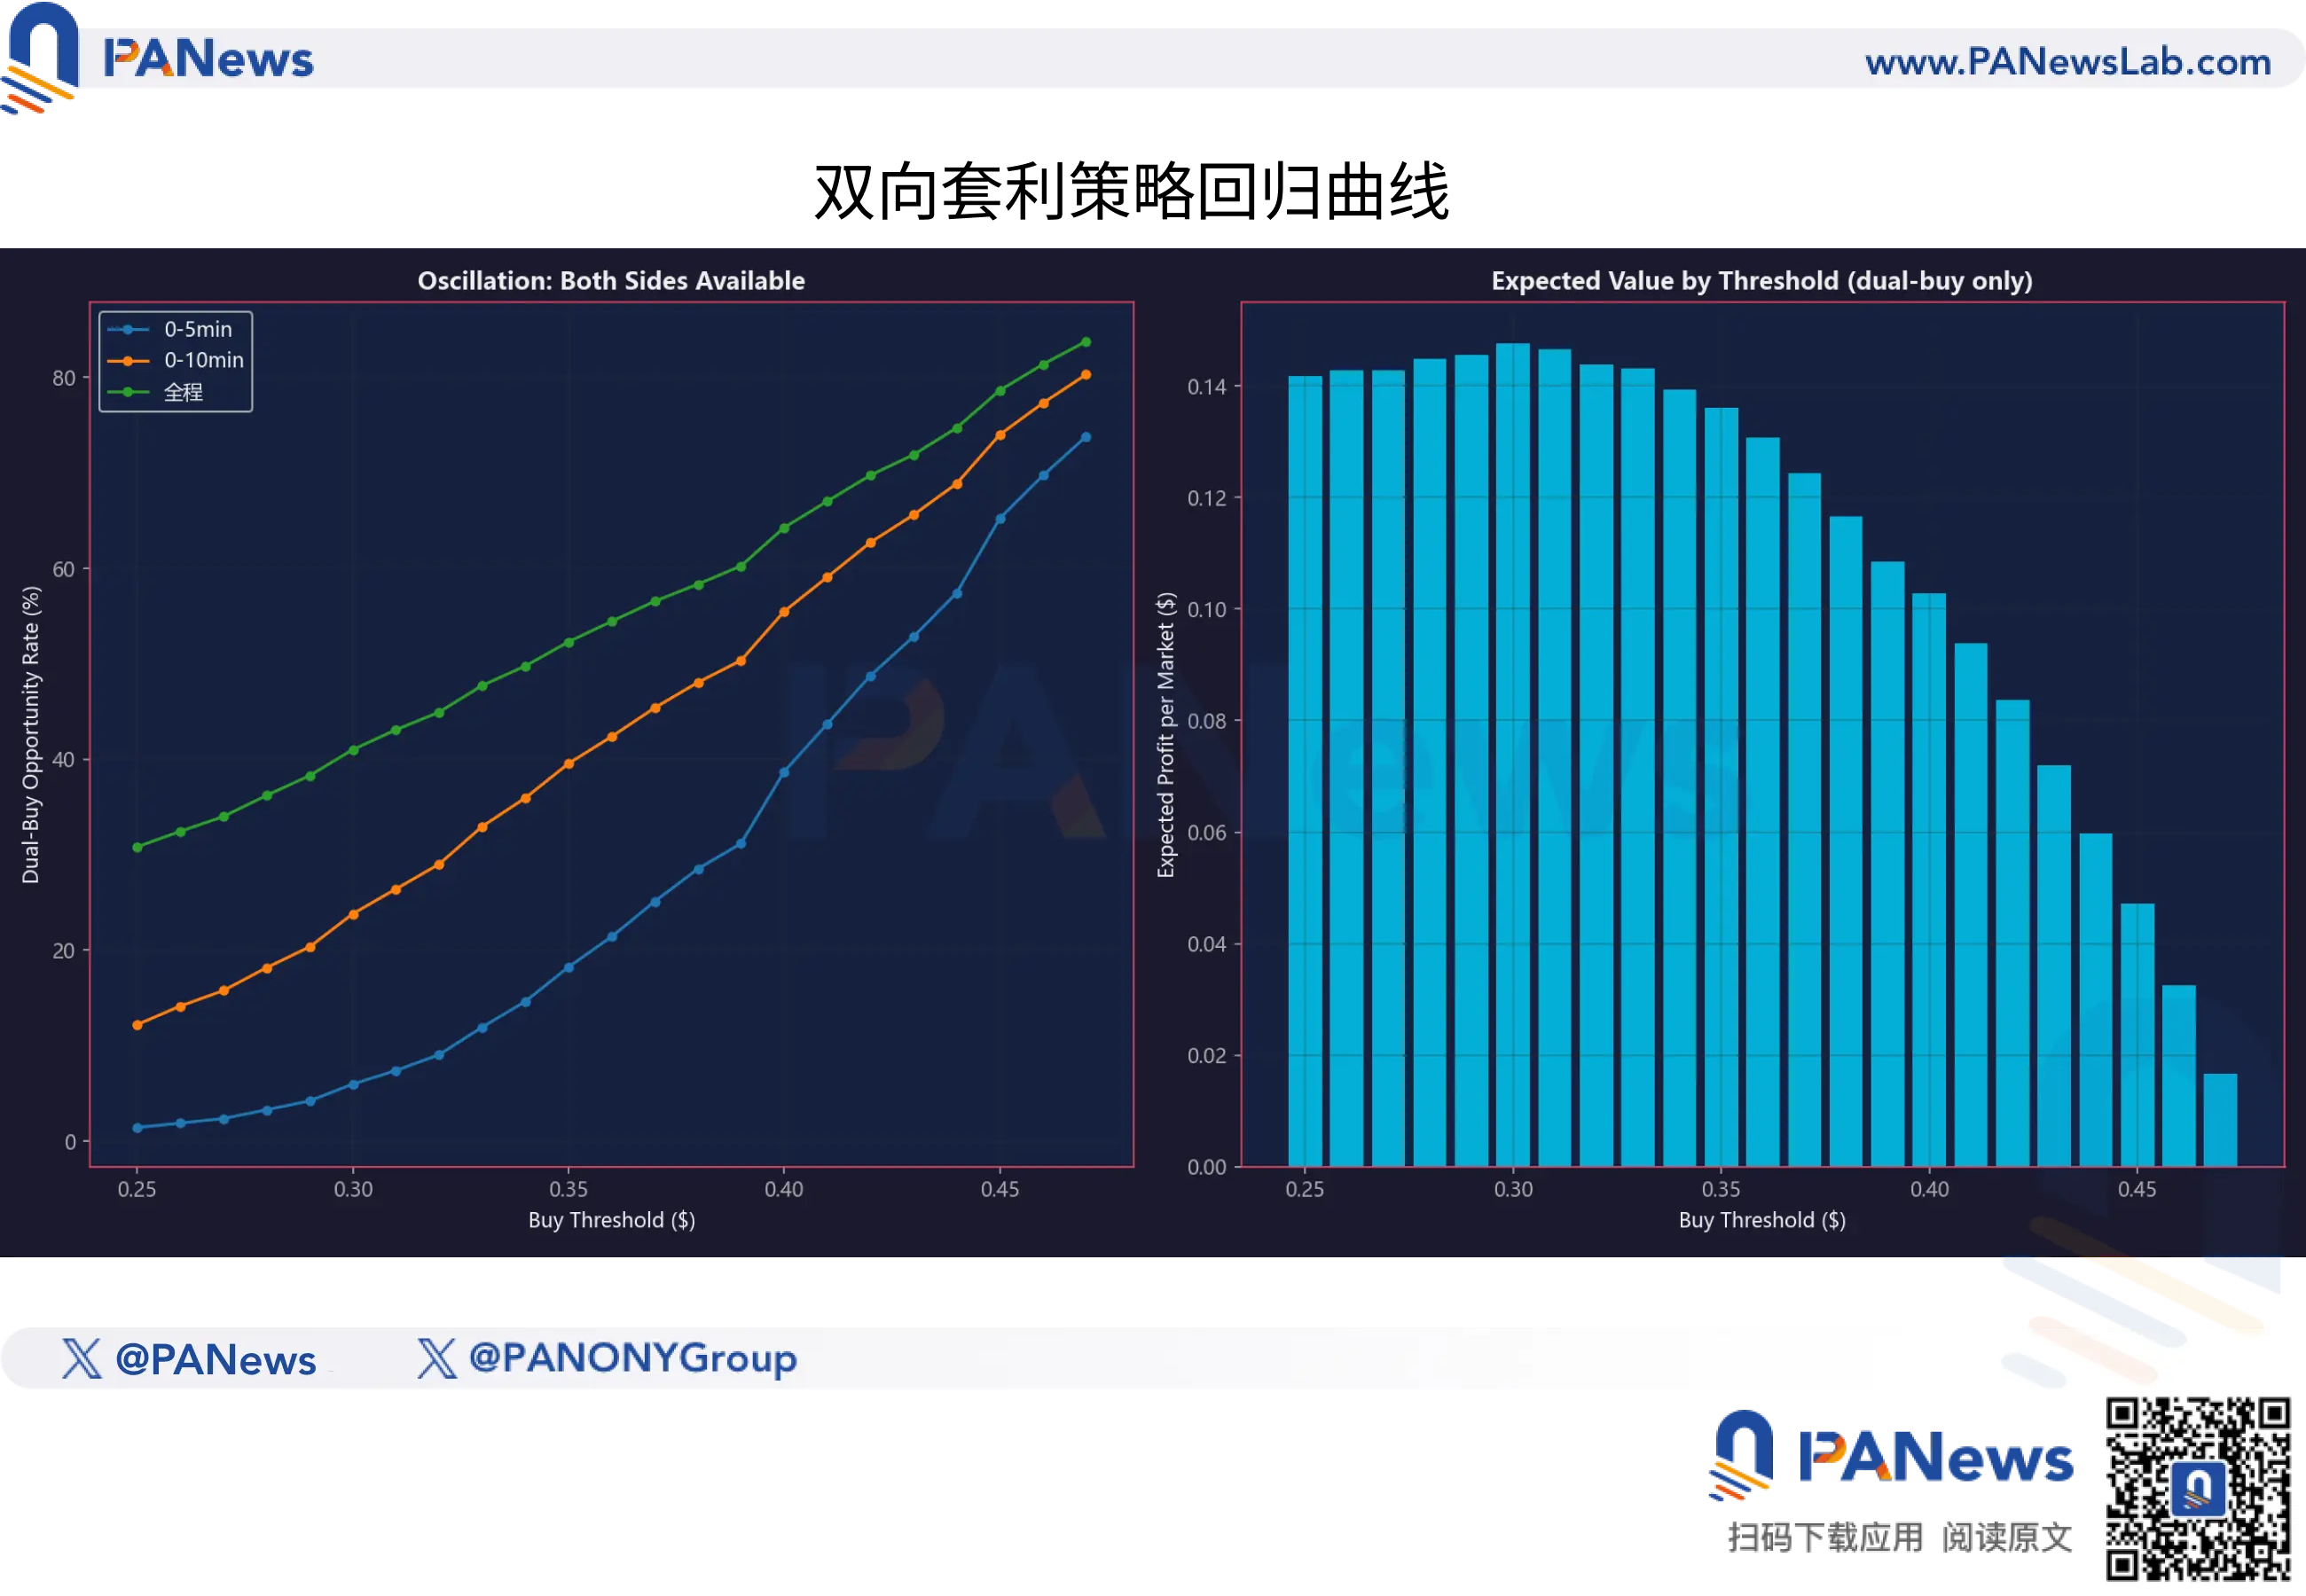
However, data shows that although this strategy has a 64.3% success rate, its low reward-to-risk ratio results in an overall negative expected value.
This “two-way strategy” looks attractive but is prone to failure. Moreover, such strategies are also based on pure theoretical assumptions detached from actual event dynamics.
Fair Value and Deviation Models: The Real “Golden Key”
So, what kind of strategy might truly be profitable?
The answer lies in the “time difference” between BTC spot prices and prediction market token prices.
PANews found that liquidity providers and market maker algorithms in prediction markets are not perfect. When BTC experiences sharp moves within a short period (e.g., 1-3 minutes), such as a sudden jump of over $150 or $200, the token prices in the prediction market do not instantly “jump” to their theoretical fair value.
Data indicates that this pricing inefficiency, measured as the deviation between market price and fair value, decays from a maximum of about 0.10 to roughly 0.05, taking around 30 seconds on average.
Thirty seconds may be a lifetime for high-frequency traders, but for manual traders, it’s a fleeting “golden window.”
This suggests that prediction markets are not perfectly efficient. They behave more like sluggish beasts that react slowly—when BTC’s trend has already shifted, they often lag behind by half a beat.
However, this does not mean that quick reflexes alone can guarantee profits. Our data further shows that the space for “delay arbitrage” is rapidly shrinking. In small BTC price fluctuations under $50, after deducting gas fees and slippage, most so-called arbitrage opportunities are actually negative expected value traps.
Beyond momentum trading relying on speed, PANews’s research reveals another profitable logic based on “value investing.”
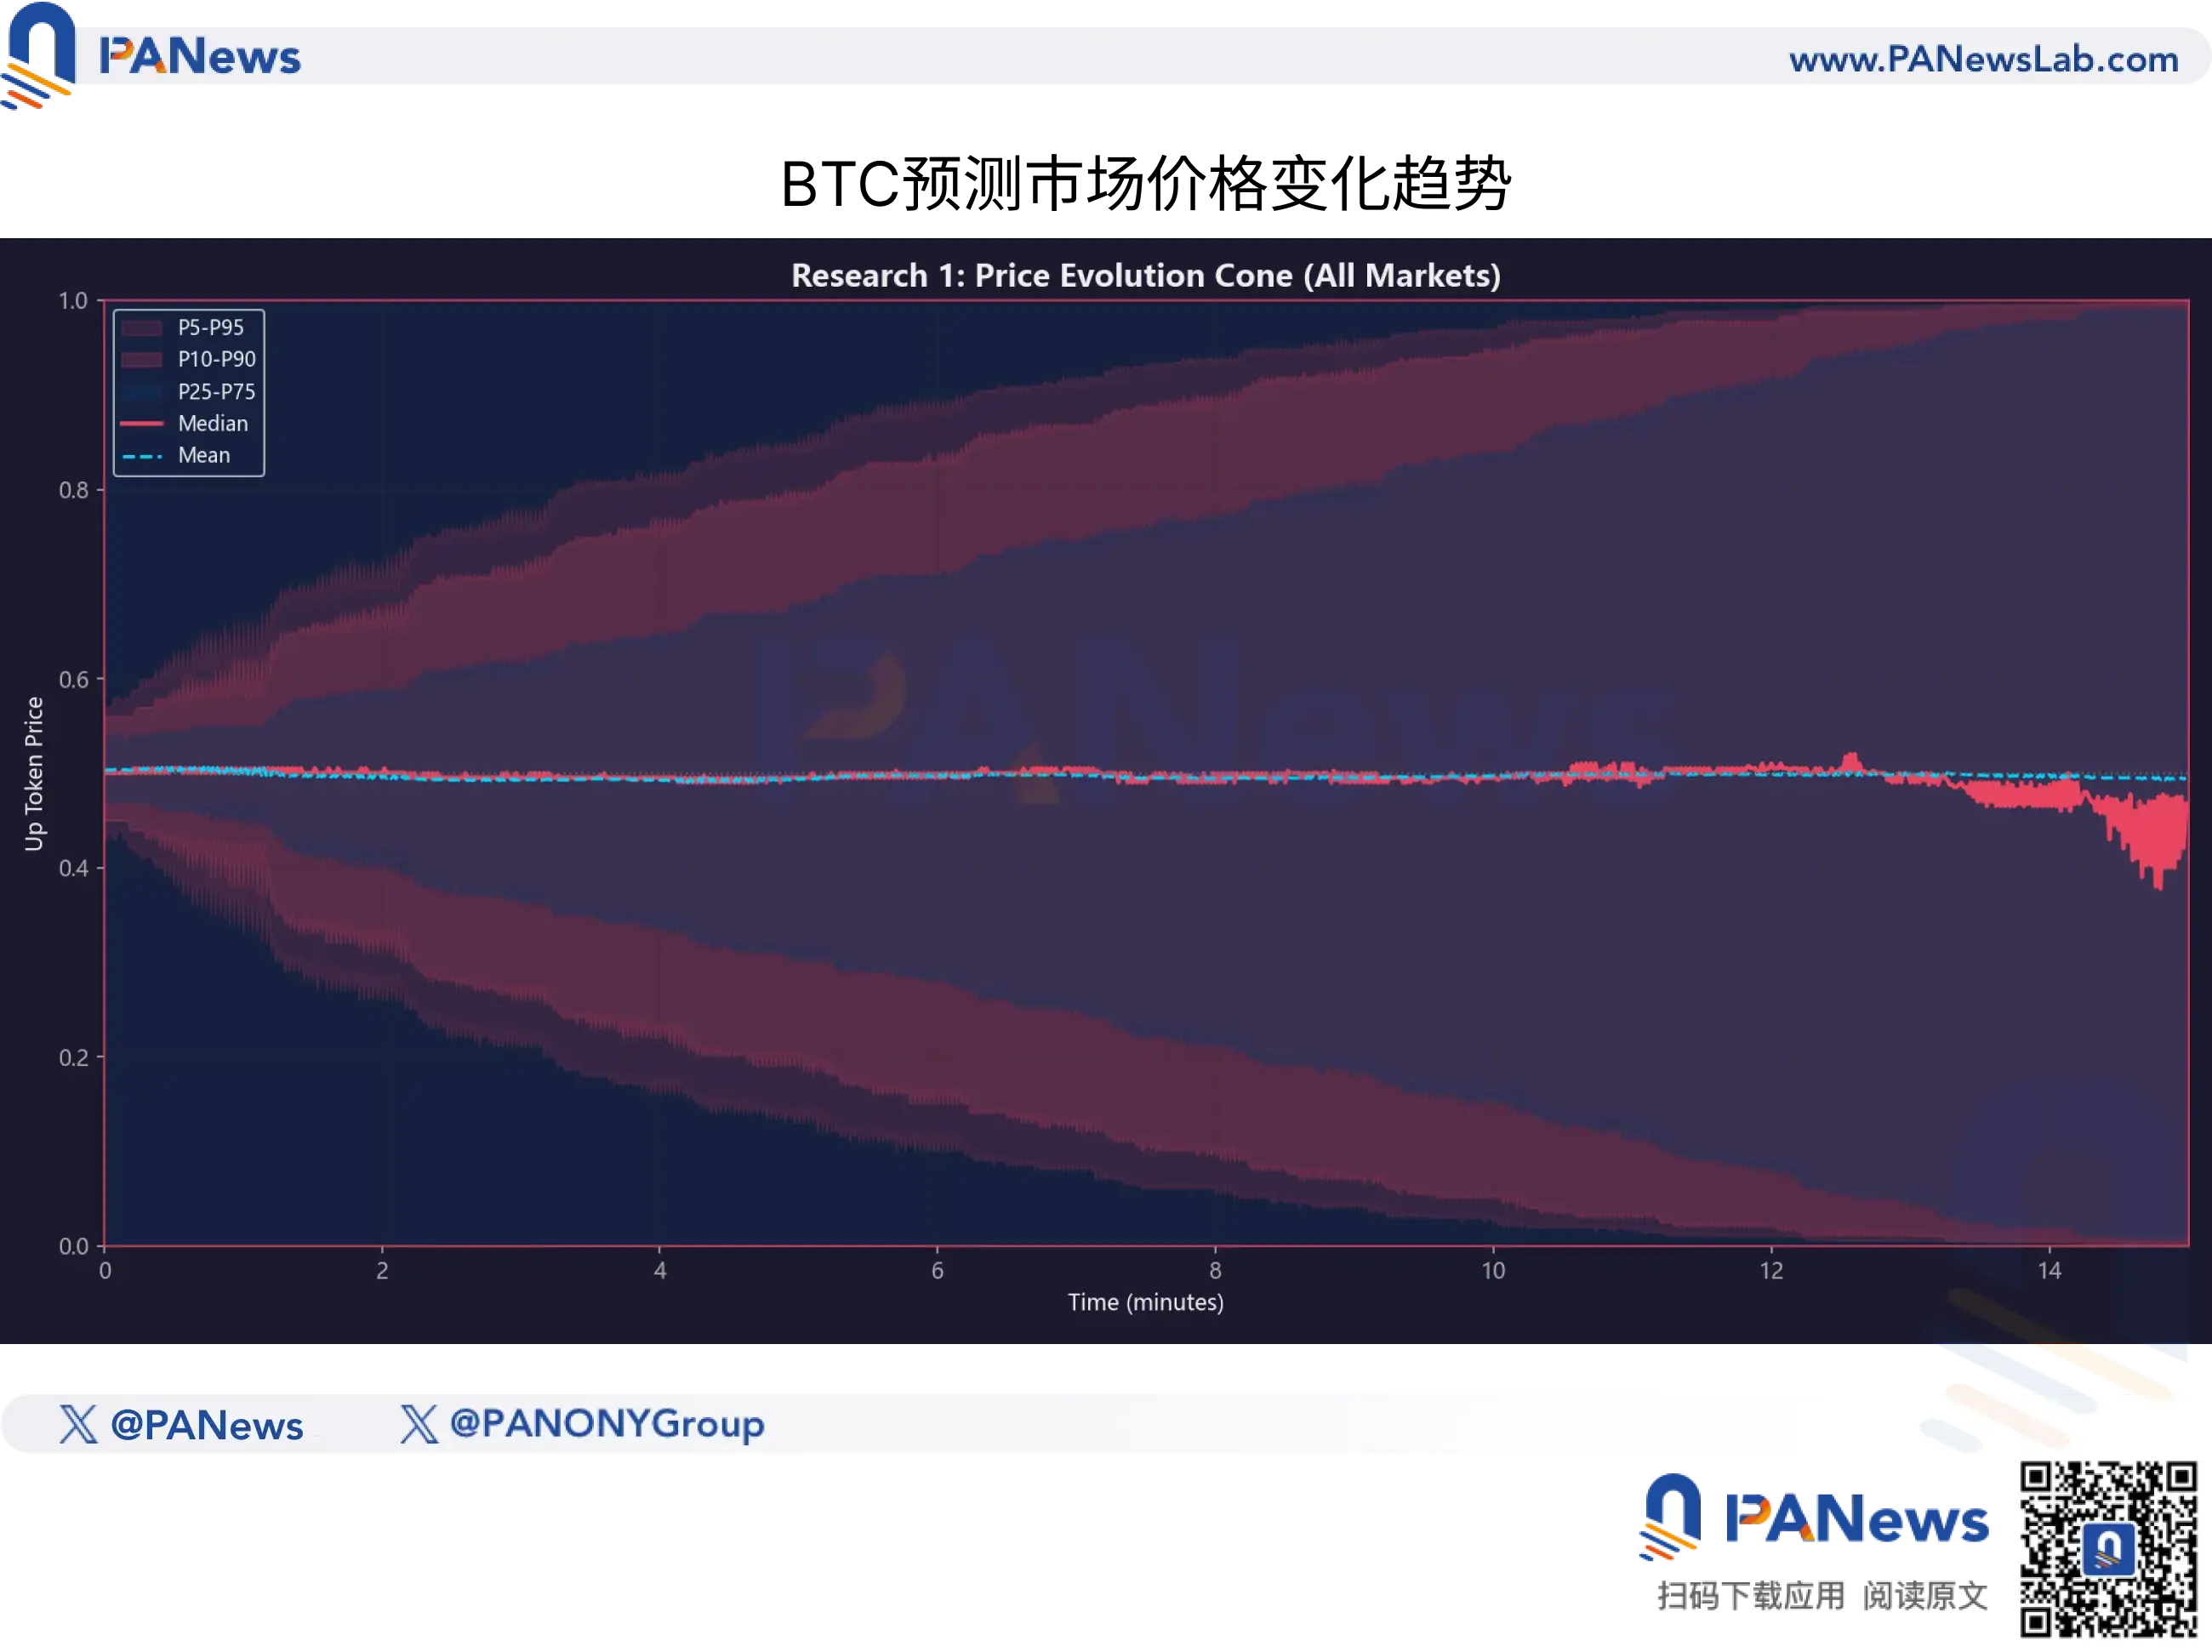
In prediction markets, “price” does not equal “value.” To quantify this, PANews built a “Fair Value Model” based on 920,000 historical snapshots. This model does not depend on market sentiment but calculates the theoretical probability of success based on BTC’s current volatility state and remaining time until settlement.
Comparing the theoretical fair value with the actual market price reveals the nonlinear nature of prediction market pricing efficiency.
1. The Magic of Time
Many retail traders intuitively believe that prices should converge linearly over time. But data shows that convergence accelerates.
For example, under the same BTC volatility conditions, the price correction speed in the last 3-5 minutes of a match is much faster than in the first 5 minutes. Yet, markets tend to underestimate this convergence speed, leading to significant deviations where token prices in the final 7-10 minutes are often well below their fair value.
2. Only “Deep Discounts” Are Worth Buying
This is the most critical risk management conclusion from this study.
Backtesting different deviation levels (market price minus fair value) shows that:
When the market price is above fair value (i.e., a premium buy), regardless of BTC’s trend, the long-term expected value (EV) is negative.
Only when the deviation exceeds 0.10—that is, the actual price is at least 10 cents below the fair value—does the trade have a robust positive mathematical expectation.
This means that for smart capital, a price of $0.70 does not imply a “70% chance of winning”; it is merely a quote. Only when the model estimates an actual success probability of 85% or higher does $0.70 become a “bargain” worth betting on.
This also explains why many retail traders lose money in prediction markets—they often buy at prices above the true fair value.
For ordinary participants, this research serves as a sobering reality check and an advanced guide. It tells us:
Abandon K-line superstition: don’t try to find patterns in the prediction token’s price chart—that’s an illusion.
Focus on the underlying asset: watch BTC’s movements, not just the prediction market.
Respect the odds: even with a 90% win rate, if the price is too high (premium), it’s a doomed trade.
In this algorithm-driven jungle, unless retail traders can establish a “fair value” mathematical framework and possess the technical ability to detect a “30-second lag,” every “Buy” click might just be a donation to the liquidity pool.
Related Articles
Bitcoin On-Chain Activity Falls to Six-Month Low, Raising Red Flags for Traders