AAVE Price Before the New Turn: Opportunity or Risk in the Coming Period?
Aave is igniting a new hope for long-term investors, thanks to its strong price performance over the past two weeks.
Since hitting a bottom at $92.25 on Friday, February 6th, this DeFi protocol’s token has surged by 29.7%, indicating a clear demand for a bottom.
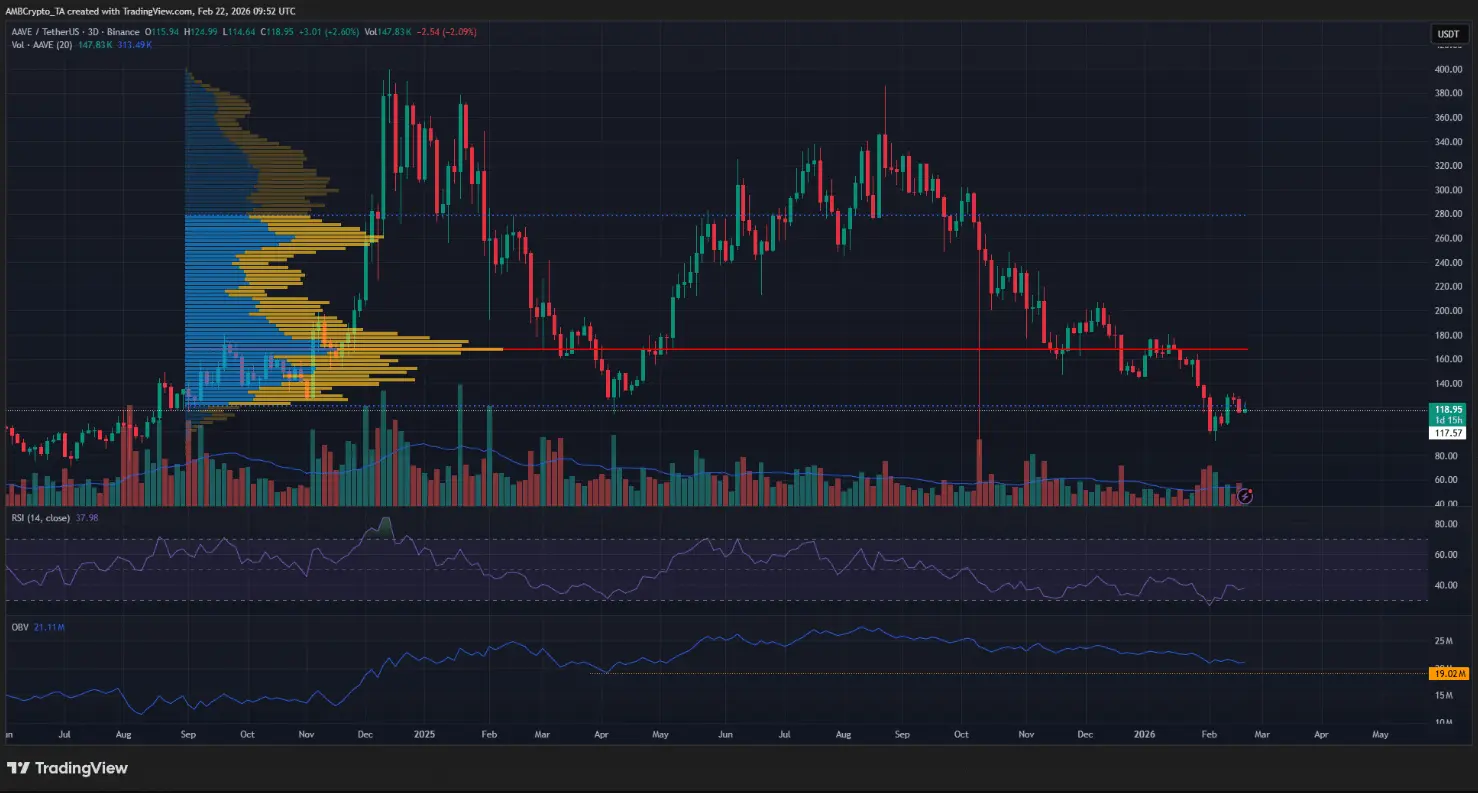 Daily BTC/USDT Chart | Source: TradingView As of writing, AAVE is trading around $119.64. However, from a broader perspective, the long-term trend of this asset still leans bearish.
The 3-day timeframe chart shows a weak technical structure, with a series of lower highs and lower lows forming continuously since the last week of September. This reflects ongoing selling pressure dominating in the medium term.
Notably, in summer 2024, the $117.57 level was a significant barrier to the bulls’ recovery efforts. After being broken in August 2024, this level paved the way for a strong rally, bringing AAVE close to $400 by the end of the year. Currently, the price is returning to this critical long-term trading zone.
The Fixed Range Volume Profile (FRVP), applied from the reversal point of support-resistance in August 2024 to now, shows the Value Area Low (blue dotted line) at $121.2, while the Point of Control (red) is at $168. These data highlight that long-term selling pressure still weighs heavily on AAVE. If the bulls cannot firmly defend the key demand zone of $80–$100, there is a significant risk of the price falling sharply to $50 by year-end.
On the positive side, the OBV indicator remains above the April 2025 lows — a sign that capital flow has not exited the market. Additionally, Aave’s revenue-generating capacity is still considered strong, according to Coin Photon reports, which helps bolster long-term bullish confidence.
Bearish signals for Aave
The total value locked (TVL) in the ecosystem once peaked at $27.7 billion but has declined to $26.3 billion over the past ten days. Notably, news that BGD Labs — one of the core service providers for Aave DAO — will withdraw in early April has exposed increasing internal rifts within the Aave ecosystem, negatively impacting investor sentiment.
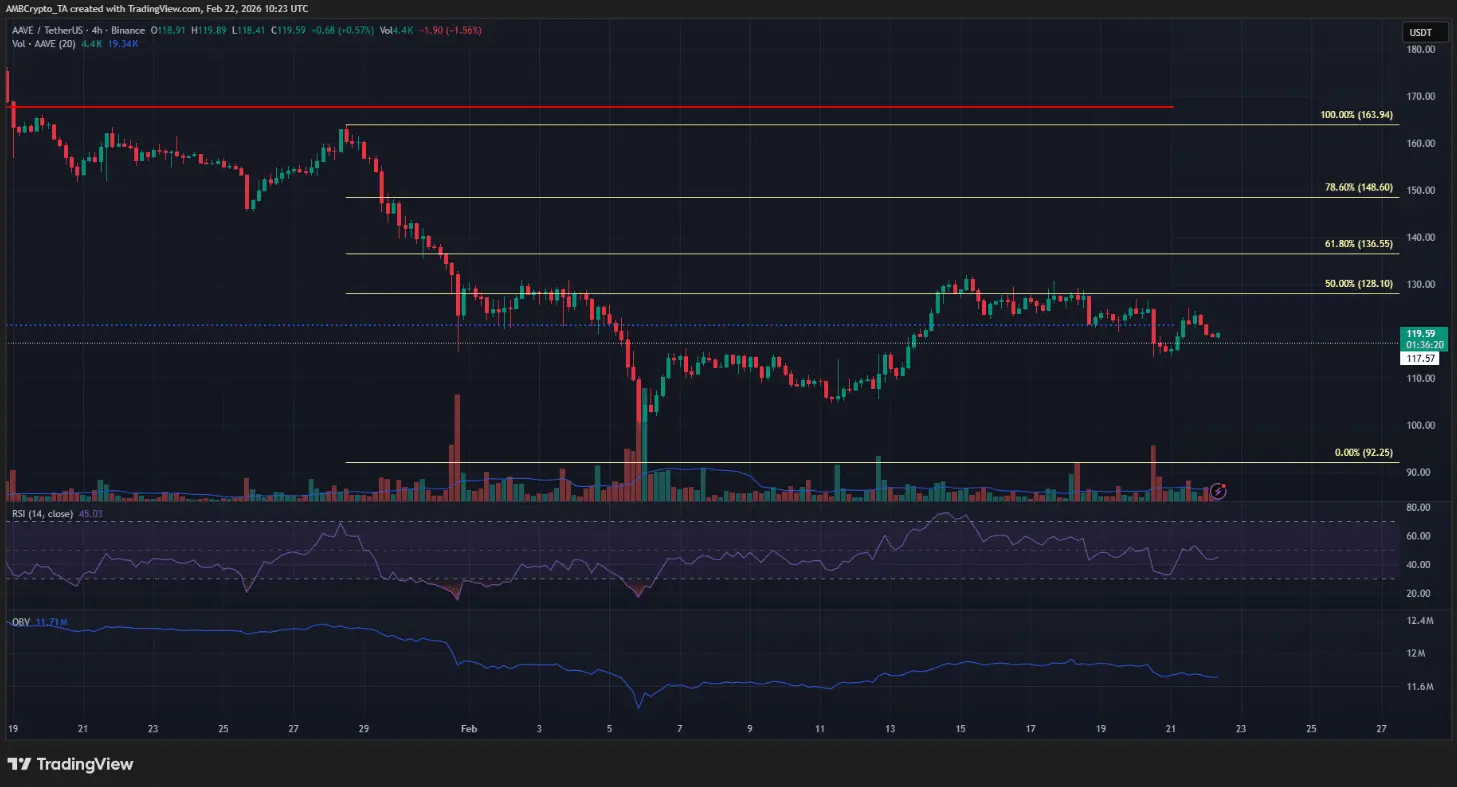 4-hour BTC/USDT Chart | Source: TradingView On the 4-hour timeframe, price action reflects significant market indecision around this altcoin. The $130 level has historically been an important supply zone throughout February. The repeated testing of this level suggests that a moderate upward push from Bitcoin could act as a catalyst for AAVE to break through this local resistance.
Conversely, the $148.6 level appears as a key resistance point. Given the prevailing long-term downtrend, a scenario where the price weakens approaching this zone is highly probable. However, if AAVE can decisively break above $163.9, it would confirm a structural shift to an uptrend and open room for a notable recovery.
Related Articles
Tariff Variables and AI Impact: US Stocks Drop, Bitcoin Falls to 63K
Prominent VC Names Dire Consequences of BTC Losing $60K - U.Today
Bitcoin On-Chain Activity Falls to Six-Month Low, Raising Red Flags for Traders
Solana Price Stabilizes Above $85 Amid Weak Trend Momentum
CARV Jumps 12% From $0.05370 Base—Will $0.0693 Resistance Give Way Today?
ZEC Price Rises to $264 as Investors Rebuild Positions