The Sandbox (SAND) just recorded a daily price increase of 13.24%, amid a surge in trading volume of over 113%. This achievement helps SAND stand out in the cryptocurrency market, which is under heavy pressure as Bitcoin drops below the $90,000 support level and Ethereum loses the $3,000 mark, reinforcing a defensive sentiment on key assets.
Although overall confidence is shaken and a broad weakening trend is spreading, SAND continues to attract attention due to increased trading volume and participation in derivative products. Traders are now more selective, shifting towards early-recovery altcoins rather than following the overall market trend. This divergence puts SAND in the spotlight as investors reassess their positions and strategies beyond Bitcoin and Ethereum during high volatility periods.
SAND Breaks Long-Standing Downtrend
On the daily chart, SAND has broken out of a multi-month downtrend channel, marking a significant structural turning point. The price has surpassed the descending resistance zone, which previously restrained recovery efforts. This move indicates that buyers have regained clear control of the market.
The breakout occurred after a consolidation phase around the $0.11 demand zone, where downward momentum waned. As the price regained the average level around $0.15, higher lows began to form, helping to bring the $0.20 zone back into potential target range rather than just a distant resistance level. This suggests that sellers no longer dominate the price structure, shifting market focus toward continued growth expectations.
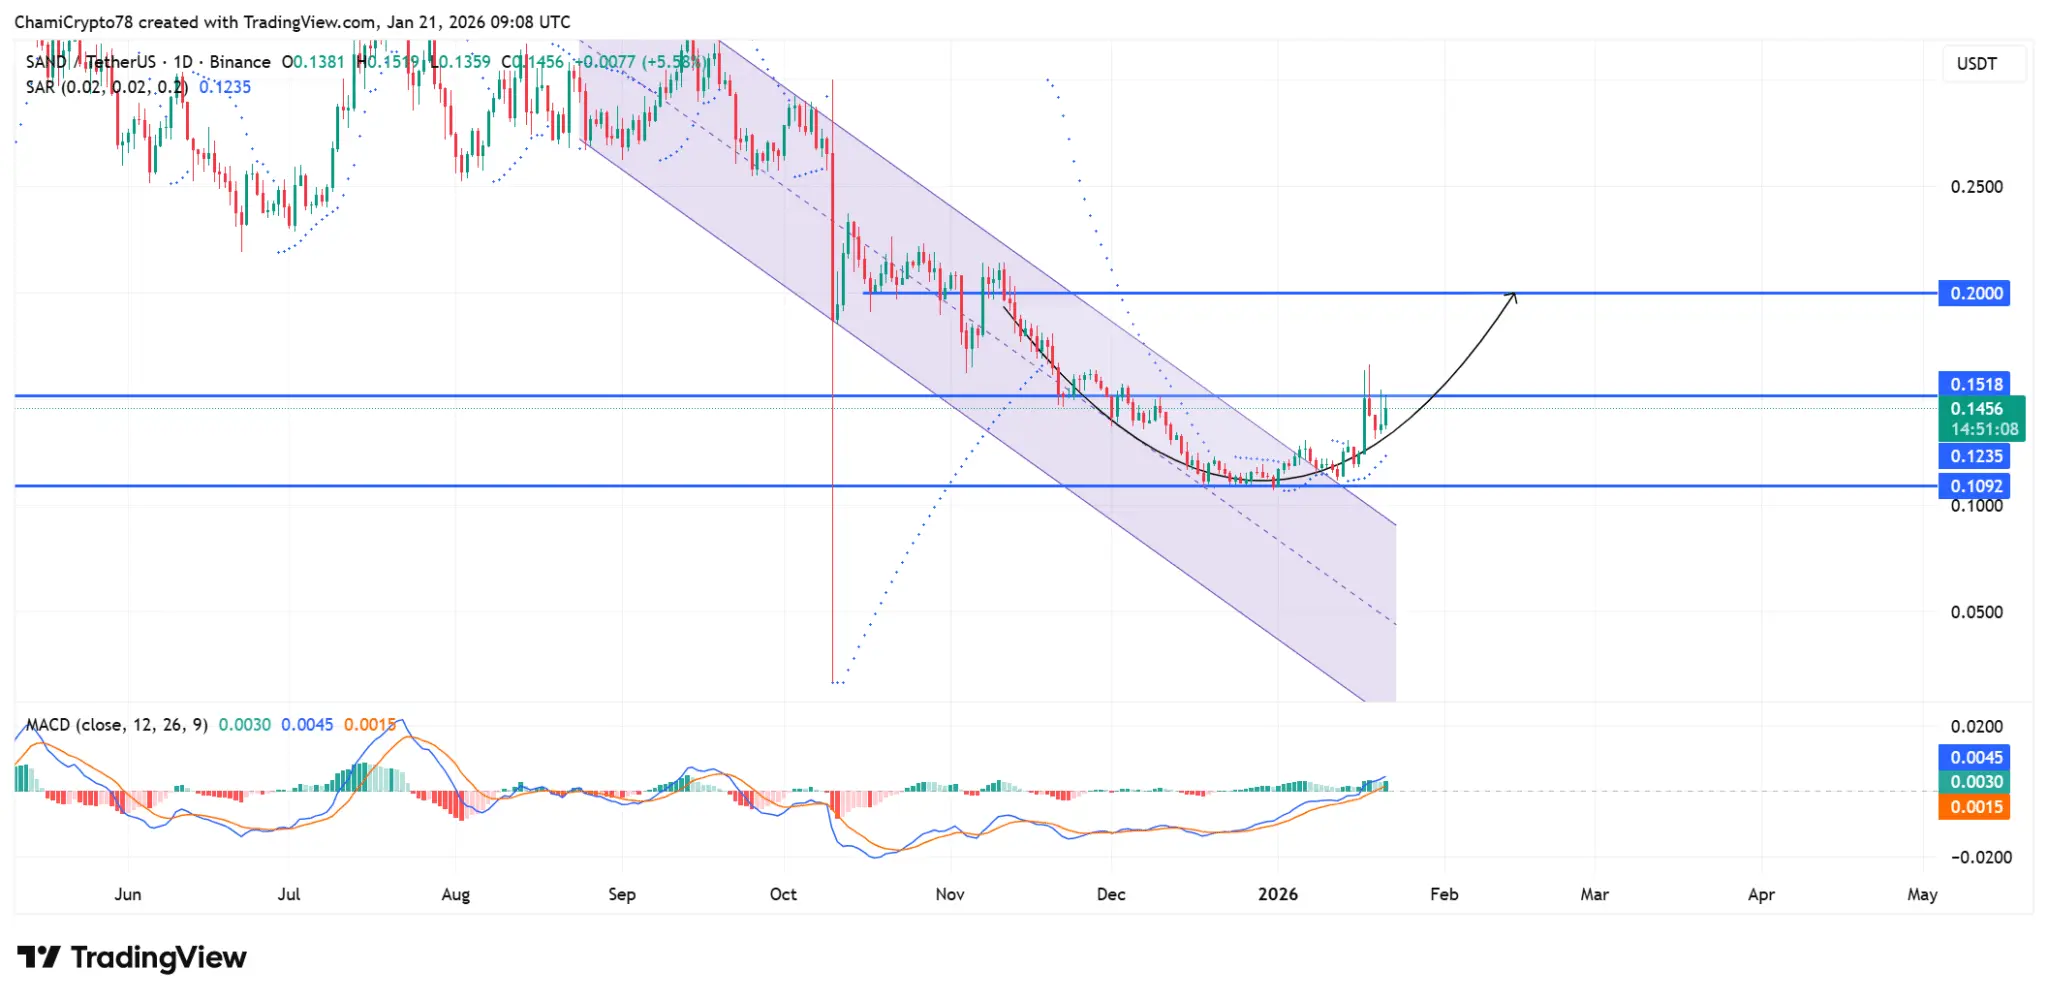 Source: TradingView Momentum indicators also reinforce this trend: MACD remains above the signal line, the histogram steadily expands, reflecting increasing buying pressure. The Parabolic SAR is below the current price, confirming the bullish trend signal. The consensus among these indicators indicates strong buying control without the need for sudden spikes. However, to confirm the trend, further price action needs to be monitored in the coming period. Nonetheless, current consensus supports the belief that SAND’s breakout is based on a strong trend foundation, not just temporary volatility.
Capital Outflows from Exchanges – Holders Continue Absorbing Supply
Spot trading volume remains negative, indicating continuous absorption of supply during the price increase. At the time of reporting, SAND has approximately $442,000 withdrawn from exchanges, reflecting a trend of tokens being steadily taken off exchanges rather than being sold back into the market. This action suggests holders are optimistic about further upward movement rather than seeking short-term profits.
Notably, the outflow coincides with a significant increase in trading volume, highlighting its importance. Buyers are absorbing liquidity without triggering strong sell-offs, while withdrawal speed remains stable, indicating strong confidence rather than accumulation driven by fear.
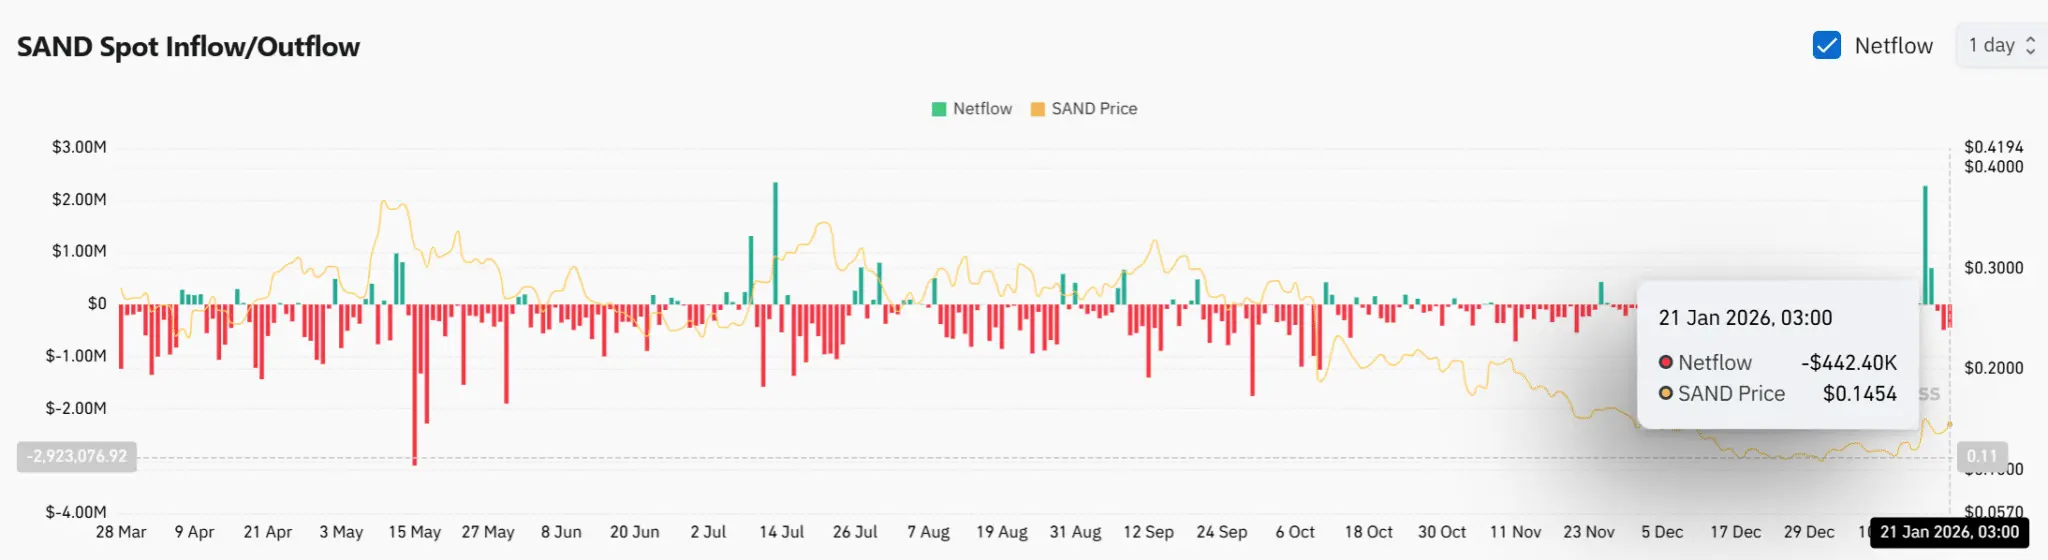 Source: CoinGlass This helps keep selling pressure low, maintaining price stability above the newly established support levels.
Leverage Increase – Traders Are Growing Their Positions
Regarding leverage, open interest (OI) has increased by 8.33% to $48.7 million, confirming that derivatives traders are actively expanding their positions alongside the strength of the spot market. The rise in open interest amid price expansion often reflects growing market confidence. However, leverage also carries volatility risks if momentum stalls, but currently, trading positions remain controlled with no signs of overheating.
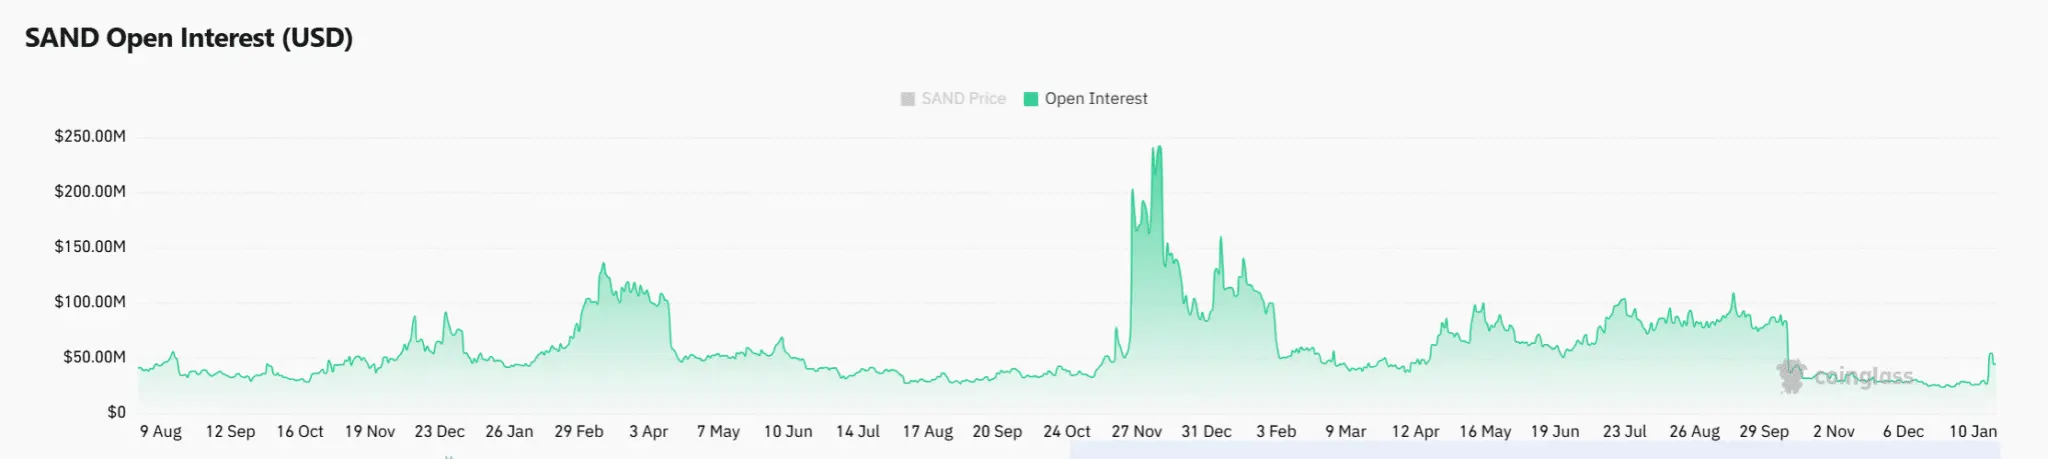 Source: CoinGlass Funding rates remain stable, indicating traders prefer to continue the trend rather than short-term speculation. The gradual increase in leverage helps reinforce the bullish trend without causing concerns of overheating. Overall, derivatives participation currently supports SAND’s upward structure.
Outlook for Breakout – SAND Continues to Attract Attention
SAND is well-positioned to break through recent resistance levels, supported by consensus momentum signals, sustained exchange outflows, and increasing derivatives activity. Although the overall market remains weak, SAND’s ability to attract volume and leverage suggests confidence in a broader recovery phase, favoring continued price gains rather than just short-term rebound.
Disclaimer: The information on this page may come from third parties and does not represent the views or opinions of Gate. The content displayed on this page is for reference only and does not constitute any financial, investment, or legal advice. Gate does not guarantee the accuracy or completeness of the information and shall not be liable for any losses arising from the use of this information. Virtual asset investments carry high risks and are subject to significant price volatility. You may lose all of your invested principal. Please fully understand the relevant risks and make prudent decisions based on your own financial situation and risk tolerance. For details, please refer to
Disclaimer.
Related Articles
Stock and bond sell-off, BTC holds the 70,000 level, Bitcoin outperformed gold this week
The ongoing military actions by the US and Israel against Iran continue to impact the market. Oil prices surged, causing US stocks and Bitcoin to decline, but Bitcoin's decline was smaller, and it outperformed gold this week. Disrupted energy supplies have sparked inflation concerns, leading to simultaneous declines in stocks and bonds. Investors remain optimistic about cryptocurrencies, with significant capital inflows.
ChainNewsAbmedia8m ago
Did Kaspa (KAS) Price Just Hit Its Cycle Low? Analyst Breaks Down What Could Happen Next
Kaspa (KAS) may be nearing a price bottom as it approaches key technical indicators like Fibonacci levels and a long-term trendline. Analysts suggest the cryptocurrency could stabilize around $0.24, potentially paving the way for a future upward move towards $1, contingent on market conditions.
CaptainAltcoin2h ago
Polkadot to Reset Tokenomics on March 12 With Major DOT Supply and Staking Changes
Polkadot will introduce a new monetary framework on March 12 that sets DOT’s supply cap at 2.1 billion and lowers emissions by 53.6%.
The overhaul will also create a Dynamic Allocation Pool and shorten the DOT unbonding period from 28 days to 24–48 hours.
On March 12, Polkadot will reset
CryptoNewsFlash3h ago
Solana Eyes $90.6 Trigger Point as $83 Support Holds and Liquidation Pressure Builds
A large cluster of short positions faces liquidation if SOL reaches $90.6, potentially increasing volatility.
SOL trades between $83.00 support and $89.58 resistance, keeping price action compressed in the short term.
SOL posts a 0.8% daily gain and rises 0.7% against BTC, holding
CryptoNewsLand4h ago
Will XRP Hold $1.33 or Extend Toward $1.30 Before Rebound?
XRP is currently trading at $1.35, experiencing a 1.3% decline. Key support is at $1.34, while resistance is at $1.40. The price is testing around the Fibonacci levels of $1.33 and $1.30, crucial for potential upward movement or deeper decline.
CryptoNewsLand4h ago
Solana Nears $95 Resistance With $17B Volume Surge
Solana approaches a key resistance level near $95, with increased trading volume and open interest signaling active trader interest. The token is currently at $90.20, facing potential upward movement if it surpasses $95, but may test $85 if rejected.
CryptoFrontNews4h ago

