
Key Takeaways
-
SPX6900 (SPX) has dropped over 4% amid broader crypto market weakness and rising liquidation pressure.
-
The daily chart shows SPX trading inside a descending triangle pattern, with price compressing toward a critical support zone.
-
Buyers continue to defend the $0.44–$0.4775 demand area, preventing a confirmed bearish breakdown so far.
-
A rebound from current levels could push SPX toward the descending resistance near $0.61.
-
A decisive breakdown below $0.44 would invalidate the support and expose SPX to further downside.
The broader cryptocurrency market is in slight under pressure on January 20, with risk sentiment turning cautious once again. Bitcoin (BTC) and Ethereum (ETH) are both trading lower, down 1.69% and 2.45% respectively over the past 24 hours. This sharp move triggered more than $286 million in liquidations, with long positions absorbing the bulk of the damage.
As volatility spreads across the market, memecoins have also felt the heat. SPX6900 (SPX) has dropped near 4%, sliding back toward a technically important area on the daily chart. However, while price action looks weak on the surface, the chart suggests SPX may be approaching a make-or-break zone that could define its next major move.
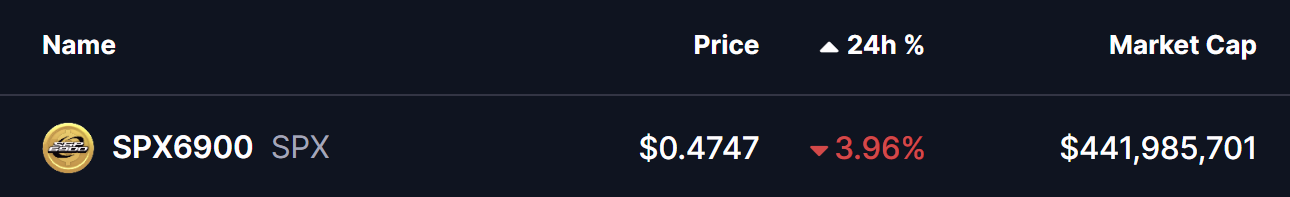
Source: Coinmarketcap
Descending Triangle Takes Shape on the Daily Chart
From a technical perspective, SPX is trading within a large descending triangle pattern on the daily timeframe. This formation is defined by a series of lower highs pressing against a relatively flat support zone — a structure that often reflects growing selling pressure.
Descending triangles are typically considered bearish, but context matters. When price repeatedly tests a strong base without breaking down, it can also signal accumulation rather than distribution.
In SPX’s case, price has once again dipped into the key demand zone between $0.44 and $0.4775. This area has acted as a reliable support throughout recent months, consistently attracting buyers whenever price revisits it. Each test of this zone has produced long lower wicks, highlighting aggressive dip-buying and a reluctance from sellers to push price lower.
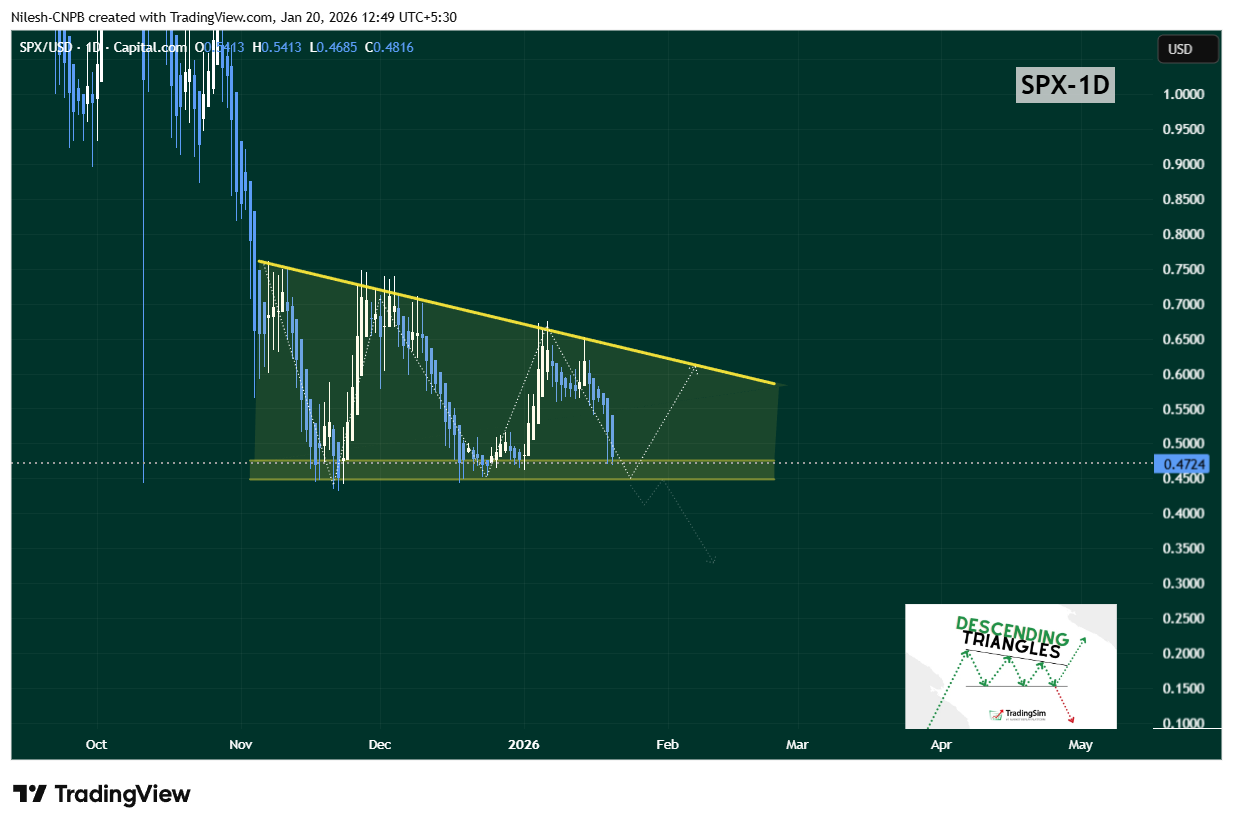
SPX6900 (SPX) Daily Chart/Coinsprobe (Source: Tradingview)
Can Buyers Defend the Base?
As long as SPX holds above the $0.44–$0.4775 support region, the descending triangle remains intact without confirmation of a breakdown. A successful defense here could trigger a relief bounce, potentially sending price back toward the upper trendline resistance near $0.61.
This descending resistance has rejected price multiple times, making it a critical level to watch. A breakout above it would mark a meaningful shift in structure and could signal that buyers are regaining control after weeks of compression.
That said, downside risk cannot be ignored. A decisive daily or weekly close below $0.44 would invalidate the support base and confirm a bearish breakdown from the triangle. Such a move could open the door for a deeper correction as trapped buyers exit positions.
Bottom Line
SPX6900 is currently sitting at a pivotal technical crossroads. While broader market weakness has pushed price lower, the daily chart shows that SPX is testing a well-defined demand zone that has consistently held in the past.
As long as buyers continue to defend the triangle’s base, a rebound toward descending resistance remains a realistic scenario. However, a failure to hold support would shift momentum firmly back in favor of sellers.
Disclaimer: The views and analysis presented in this article are for informational purposes only and reflect the author’s perspective, not financial advice. Technical patterns and indicators discussed are subject to market volatility and may or may not yield the anticipated results. Investors are advised to exercise caution, conduct independent research, and make decisions aligned with their individual risk tolerance.
About Author: Nilesh Hembade is the Founder and Lead Author of Coinsprobe, with over 5 years of experience in the cryptocurrency and blockchain industry. Since launching Coinsprobe in 2023, he has been providing daily, research-driven insights through in-depth market analysis, on-chain data, and technical research.
Disclaimer: The information on this page may come from third parties and does not represent the views or opinions of Gate. The content displayed on this page is for reference only and does not constitute any financial, investment, or legal advice. Gate does not guarantee the accuracy or completeness of the information and shall not be liable for any losses arising from the use of this information. Virtual asset investments carry high risks and are subject to significant price volatility. You may lose all of your invested principal. Please fully understand the relevant risks and make prudent decisions based on your own financial situation and risk tolerance. For details, please refer to
Disclaimer.
Related Articles
Bitcoin Short-Term Holders Discount Narrows to -5.7%, SOPR Signals Recovery
Gate News message, April 24 — Bitcoin short-term holders (STH) are showing signs of recovery as their discount narrowed from -21.6% to -5.7%, according to on-chain analyst Axel Adler Jr. The STH-SOPR (Spent Output Profit Ratio) 7-day moving average has climbed back above 1.0, indicating that short-t
GateNews44m ago
ARK Invest Report: Bitcoin confident buyers increased their holdings by 69%, and the bottom range hasn’t been tested yet
According to the Q1 2026 Bitcoin Quarterly Report released by ARK Invest on April 24, the holdings of Bitcoin “confidence buyers” increased from 2.13 million BTC to 3.60 million BTC, up 69% quarter-over-quarter. ARK Invest said that the key support range for the cyclical bottom as defined by the firm ($54,000 to $50,000) was not tested by the end of the first quarter.
MarketWhisper1h ago
XRP Price Eyes Final Resistance at $1.53 — Breakdown Risk Toward $0.87 Looms
XRP approaches $1.53 resistance as Wave E nears completion
$1.39 support must hold to maintain bullish structure
Rejection could push XRP down toward $1.09 to $0.87
Ripple’s XRP has reached a decisive moment that traders cannot ignore. Price action now approaches a critical resistance
CryptoNewsLand1h ago
Bitcoin Stalls at $77.8K Amid Japan Inflation Surge and Iran War Tensions
Gate News message, April 24 — Crypto markets weakened on Friday as Bitcoin hovered near $77,800 and Ethereum fell to $2,300 with a 24-hour decline of 0.8%. The uptrend that began Wednesday from $65,000 has visibly slowed, with Ethereum underperforming Bitcoin.
Market pressure stems from Japan's Mar
GateNews3h ago
Gate Daily Report (April 24): US Treasury sanctions Cambodian crypto “pig butchering” scams; Tether mints an additional 1 billion USDT
Bitcoin (BTC) rebound momentum is weakening, with a temporary quote around $78,030 as of April 24. The U.S. Treasury Department’s Office of Foreign Assets Control (OFAC) sanctioned a Cambodian politician linked to a crypto “pig butchering” scam center. Tether issued another 1 billion USDT on the Ethereum network; over the past 5 days, it has issued a total of 3 billion USDT on the Ethereum network.
MarketWhisper5h ago
Trump ordered the sinking of ships in the Strait of Hormuz, and Bitcoin’s rebound momentum weakened to 78k
U.S. President Donald Trump posted on Truth Social on April 24, announcing that the ceasefire agreement between Israel and Lebanon will be extended by three weeks. On the same day, he also ordered the U.S. Navy to “sink any vessel currently laying mines in the Strait of Hormuz,” and instructed the military to carry out mine-clearing operations with “three times the force.” Brent crude spot prices have returned above $100, and Bitcoin is trading near $78,000 under pressure and consolidating.
MarketWhisper5h ago