Worldcoin (WLD), Canton (CC), and Jupiter (JUP) continue to maintain their upward momentum over the past 24 hours, despite the overall cryptocurrency market showing signs of stagnation following the Federal Reserve’s decision to keep interest rates unchanged announced on Wednesday. While Worldcoin is entering a short-term correction phase, Canton and Jupiter are approaching key resistance zones. From a technical perspective, the strongest performing assets of the day may face a reversal risk as selling pressure at resistance levels continues to increase.
Worldcoin loses momentum after 25% surge
Worldcoin (WLD) experienced a decline of about 5% on Thursday, as the price corrected back from the 100-day Exponential Moving Average (EMA) after a strong 25% breakout the previous day. The 50, 100, and 200-day EMAs remaining downward indicates that the bearish trend still dominates in the medium term.
In a negative scenario, if WLD continues to weaken and breaks below the 50-day EMA at $0.5547, selling pressure could intensify, pushing the price back to a key psychological support level around $0.5000.
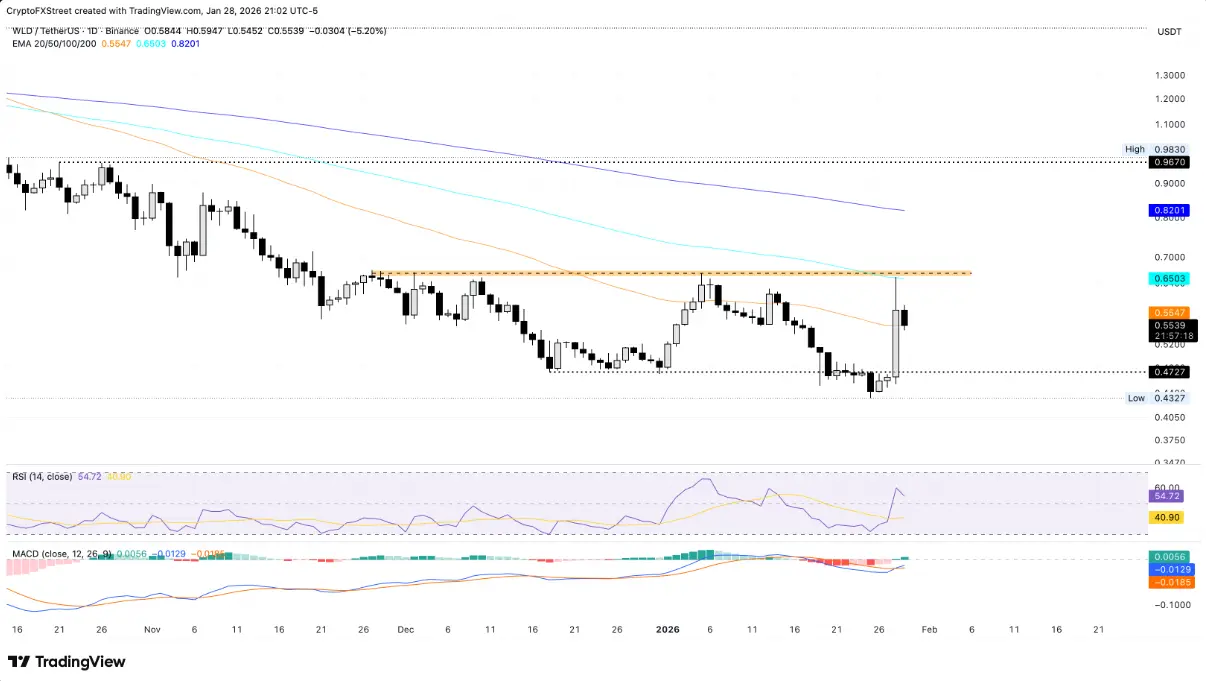 Daily WLD/USDT chart | Source: TradingViewOn the other hand, technical signals are beginning to show signs of improvement. The MACD histogram has shifted into positive territory as the MACD line crosses above the signal line near the zero mark, indicating increasing bullish momentum and the potential for an early recovery. Meanwhile, the Relative Strength Index (RSI) oscillates around 51, reflecting a neutral state and temporary market balance after recent strong volatility.
If WLD can break out and close stably above the 100-day EMA at $0.6503, the recovery momentum is likely to extend, with the next target around the 200-day EMA near $0.8201.
Canton at key resistance, aiming for upside targets
Canton is currently trading near a critical resistance zone at $0.1624, coinciding with the peak recorded on January 2nd. As of this writing, CC has risen slightly by 2% on Thursday, following a 2% increase on Wednesday, indicating stable buying pressure.
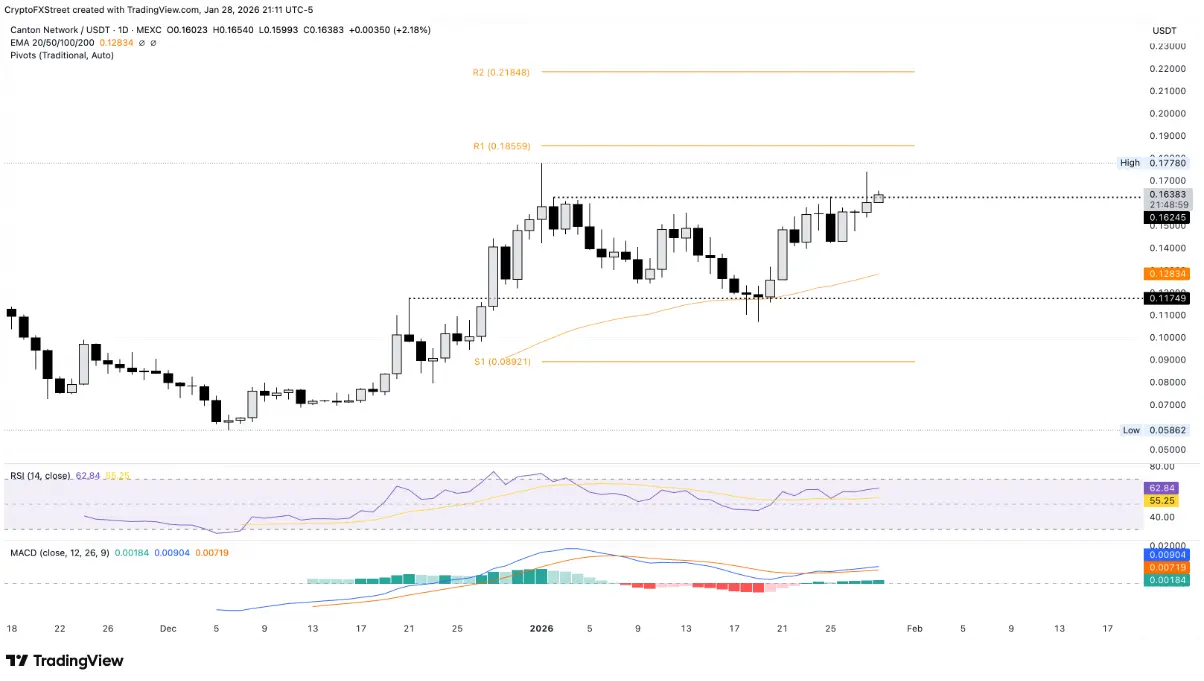 Daily CC/USDT chart | Source: TradingViewIf CC breaks above and closes convincingly above this level, the bullish trend is likely to target the R1 Pivot Point at $0.1855. The RSI remains sideways around 62, reflecting steady buying pressure and room for further gains before reaching overbought territory. Meanwhile, the MACD line and signal line continue to rise above zero, with expanding green histogram bars, confirming strong bullish momentum.
Conversely, if Canton drops below the round level of $0.1500, the 50-day EMA at $0.1283 will serve as an important support zone, helping to curb selling pressure.
Jupiter’s rally stalls at the 50-day EMA
Jupiter (JUP) is facing strong resistance at the 50-day EMA at $0.2174, after experiencing a 16% rally in the first three days of the week. As of now, JUP has declined nearly 1% on Thursday as pressure at the 50-day EMA increases.
If the current trading session closes below this level, the price could revisit the critical psychological level of $0.2000.
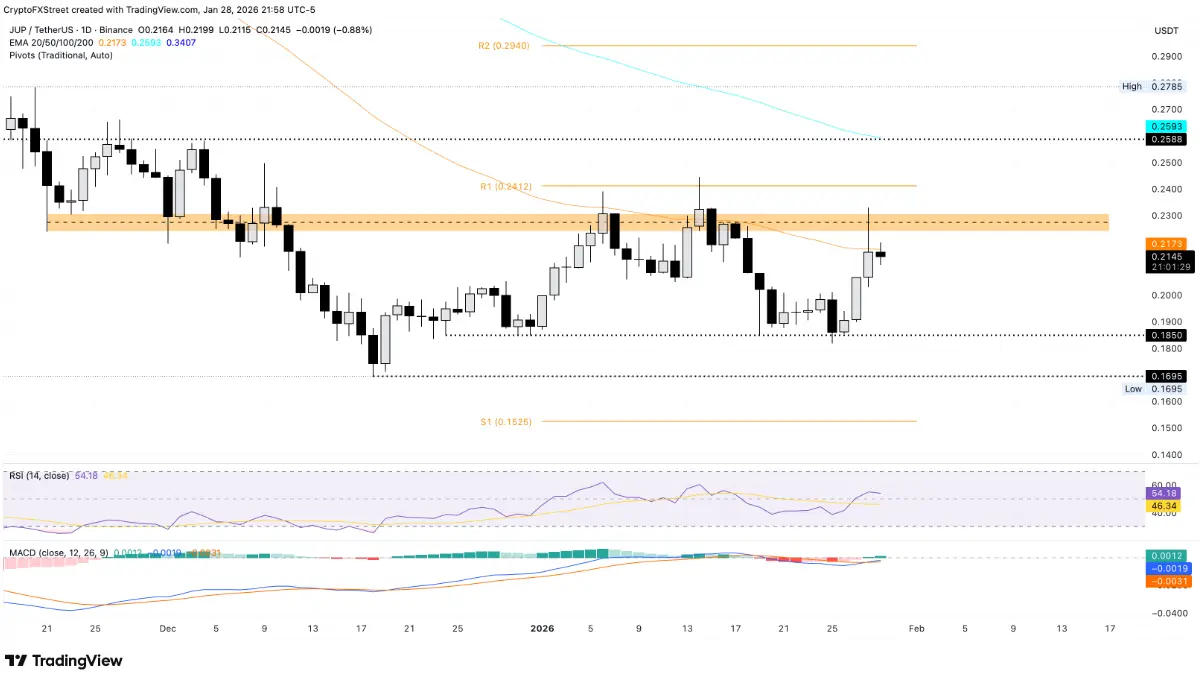 Daily JUP/USDT chart | Source: TradingViewFrom a technical standpoint, the MACD still signals a buy with a bullish crossover forming, while the RSI is at 54 and trending upward from the neutral zone, indicating that buying interest is gradually recovering after the previous rally.
If JUP breaks below the 50-day EMA, the next strong resistance zone between $0.2240 and $0.2308 could potentially control the upward movement.
Disclaimer: The information on this page may come from third parties and does not represent the views or opinions of Gate. The content displayed on this page is for reference only and does not constitute any financial, investment, or legal advice. Gate does not guarantee the accuracy or completeness of the information and shall not be liable for any losses arising from the use of this information. Virtual asset investments carry high risks and are subject to significant price volatility. You may lose all of your invested principal. Please fully understand the relevant risks and make prudent decisions based on your own financial situation and risk tolerance. For details, please refer to
Disclaimer.
Related Articles
Bitcoin’s attempt to break the $80k mark fell short, and MicroStrategy has launched a new stock issuance to kick off a Bitcoin flywheel
Due to the Iran–U.S. standoff, the market is focused on tech companies’ earnings reports and the Federal Reserve’s decision. Bitcoin has not broken through 80,000 again, and the Fear & Greed Index has steadied. Last week, MicroStrategy bought another 3,273 BTC, bringing its holdings to 818,334 BTC. The stock price is up about 30% over the past month, mNAV has risen to 1.25, and the Bitcoin flywheel has been set in motion. Iran has opened the Strait of Hormuz and temporarily delayed nuclear talks; the White House says there is discussion. Alphabet, Microsoft, Amazon, Meta, and Apple will release their earnings reports, and the central bank’s decision is also in the spotlight. Investors are watching risks from inflation and oil prices.
ChainNewsAbmedia11m ago
PEPE Price Climbs as Bulls Test Key Resistance Breakout
Key Insights
Pepe’s price rises for three days as improving sentiment boosts retail demand, supported by stronger participation and steady gains in futures open interest.
Futures open interest climbs above $213 million, signaling growing trader confidence as rising positions align with
CryptoNewsLand4h ago
Zcash Price Jumps 12% as Demand Drives Push Toward $400
Key Insights
Zcash surged nearly 12 percent, rebounding from $300 support as renewed buying interest pushed the price toward the $360 level during Friday’s trading session.
Increased demand for privacy coins and rising shielded pool usage reduced liquid supply, supporting stronger price
CryptoNewsLand4h ago
U.S.-Iran Talks Show Limited Progress as Bitcoin Dips Below $77K; Nvidia Hits Record High
Gate News message, April 27 — Amid ongoing U.S.-Iran negotiations, Bitcoin retreated slightly on Monday, dropping below $77,000 before recovering to $77,046, down 1.7% over the past 24 hours. Iran proposed a "open roads first, nuclear talks later" framework, but U.S. officials expressed skepticism a
GateNews4h ago
FIO Token Surges 25.09% in One Hour, Trading at $0.001097
Gate News message, April 27 — FIO token surged 25.09% in one hour and is currently trading at $0.001097. Over the past 24 hours, FIO has posted a 41.68% gain, with a high of $0.001097 and a low of $0.000869. Trading volume reached $163,110,280.67, and the token's market capitalization stands at
GateNews4h ago
Dogecoin Holds Range as Volume Surge Signals Breakout Risk
Key Insights:
Dogecoin recorded over $800 million in daily transactions, reflecting one of its strongest activity spikes this year alongside rising accumulation from large holders.
Whale accumulation exceeded $330 million in one week, reinforcing demand strength while the price remains
CryptoNewsLand5h ago