
Key Takeaways
-
Algorand (ALGO) is consolidating after a 13% decline over the past 60 days, while showing stabilization in the last month.
-
The daily chart reveals a repeating bullish fractal, similar to the setup that triggered ALGO’s 300% rally in November 2024.
-
Price is holding inside a long-term accumulation zone between $0.11 and $0.1530.
-
The 200-day moving average near $0.1912 is acting as key resistance and breakout confirmation level.
-
A successful reclaim of the 200 MA could open the path toward $0.60 and the ascending resistance trendline, while a drop below $0.11 would invalidate the bullish setup.
ALGO, the native token of Algorand’s Layer-1 blockchain, has shown steady but muted momentum over the past 30 days, helping slow down its broader correction. Despite this stabilization, ALGO remains down more than 13% over the last 60 days, keeping sentiment cautious across the market.
That said, when looking beyond short-term price noise, the daily chart is beginning to tell a familiar story. The current structure closely resembles a bullish fractal that, in the past, preceded a powerful breakout rally—raising an important question for traders: is this just consolidation, or a quiet accumulation phase before the next move?
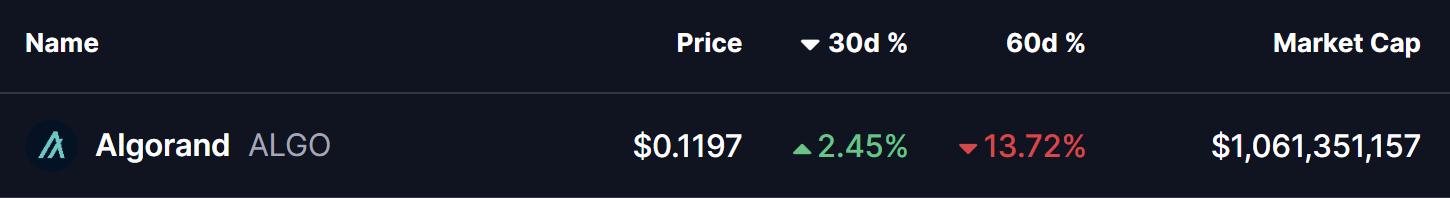
Source: Coinmarketcap
Fractal Setup Hints at a Bullish Reversal
On the daily timeframe, ALGO is displaying early signs of a repeating bullish structure, built around three key technical elements:
-
A rejection from the long-term ascending resistance trendline
-
A prolonged accumulation zone at major historical support
-
A potential reclaim of the 200-day moving average
The current corrective phase began in December 2024, when ALGO was rejected near the ascending resistance trendline around $0.60. That rejection triggered a deep pullback of more than 80%, eventually driving price back into the long-term demand zone between $0.11 and $0.1530—a region that has repeatedly acted as an accumulation area on the chart.
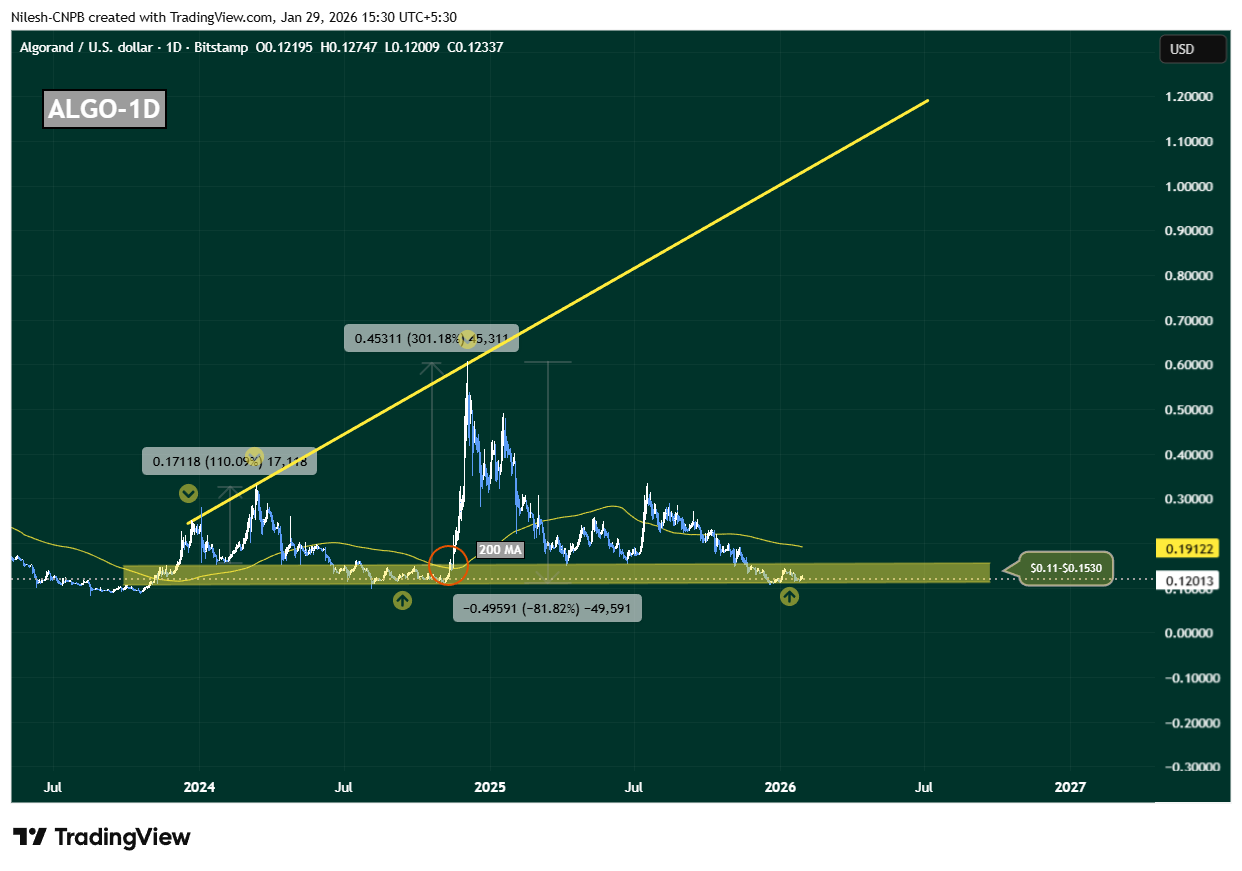
Algorand (ALGO) Daily Chart/Coinsprobe (Source: Tradingview)
This zone is not just technically important; it has also served as a launchpad during previous cycles, where downside momentum stalled and long-term buyers quietly stepped in.
History Rhymes on the ALGO Chart
What makes this setup particularly compelling is how closely it mirrors November 2024’s breakout structure. Back then, ALGO spent extended time consolidating near the same support band before reclaiming the 200-day moving average. Once that level flipped into support, price accelerated sharply—resulting in a 300% rally toward the ascending resistance trendline.
Today, ALGO is once again compressing inside this accumulation range, while the 200-day moving average sits overhead near $0.1912, acting as dynamic resistance. This alignment suggests the market may be approaching another inflection point.
What’s Next for ALGO?
At present, ALGO is hovering near $0.12, firmly inside its long-term accumulation zone. As long as price holds above this region, the broader bullish fractal remains intact.
A clean and sustained reclaim of the 200-day moving average around $0.1912 would be a critical confirmation signal. If bulls manage to flip this level into support, it would closely replicate previous breakout conditions and could trigger a sharp upside expansion. In that scenario, $0.60 becomes a realistic medium-term target, with further upside possible toward the ascending resistance trendline if momentum builds.
However, the structure is not without risk. A decisive breakdown below $0.11 would weaken the accumulation thesis, signal loss of long-term support, and open the door for deeper downside.
For now, ALGO sits at a make-or-break zone. The chart suggests patience is key—but if history repeats, this quiet phase may not last much longer.
Disclaimer: The views and analysis presented in this article are for informational purposes only and reflect the author’s perspective, not financial advice. Technical patterns and indicators discussed are subject to market volatility and may or may not yield the anticipated results. Investors are advised to exercise caution, conduct independent research, and make decisions aligned with their individual risk tolerance.
About Author: Nilesh Hembade is the Founder and Lead Author of Coinsprobe, with over 5 years of experience in the cryptocurrency and blockchain industry. Since launching Coinsprobe in 2023, he has been providing daily, research-driven insights through in-depth market analysis, on-chain data, and technical research.
Disclaimer: The information on this page may come from third parties and does not represent the views or opinions of Gate. The content displayed on this page is for reference only and does not constitute any financial, investment, or legal advice. Gate does not guarantee the accuracy or completeness of the information and shall not be liable for any losses arising from the use of this information. Virtual asset investments carry high risks and are subject to significant price volatility. You may lose all of your invested principal. Please fully understand the relevant risks and make prudent decisions based on your own financial situation and risk tolerance. For details, please refer to
Disclaimer.
Related Articles
19.78% Surge for LRC: What It Means for Investors
LRC surged 19.78% amid market selling, now trading at $0.02986 with a daily volume of over $3 million. Whale activity and altcoin rotation drive interest, as traders monitor key resistance and support levels for future movements.
Coinfomania13m ago
Bitcoin ETF Ends Seven-Day Winning Streak, Bitcoin Price Pressure Returns
US Bitcoin spot ETFs have turned to outflows following seven consecutive trading days of net inflows, indicating a shift toward more conservative capital allocation. Bitcoin price briefly fell below $70,000, reflecting weakened market sentiment and capital flows. ETF outflows stem from market reassessment of the macro environment, as investors reduce risk appetite amid elevated interest rate expectations and geopolitical risks. $70,000 has become a near-term technical dividing line between bulls and bears, with technical indicators suggesting market confidence still needs to be restored.
区块客17m ago
Xinda Futures: Rising Energy Prices Constrain Rate Expectations, Gold Under Short-Term Pressure
Xinda Futures research indicates that gold price movements are influenced by rising energy prices and interest rate expectations. The Middle East conflict has kept crude oil at elevated levels, intensifying inflation concerns in the market and suppressing gold prices. The market expects the Federal Reserve to maintain interest rates unchanged, but Powell's assessment will impact subsequent policy decisions.
GateNews1h ago
Iran Bombs Israel "Nuclear Facility Surroundings" for First Time, No Nuclear Leakage So Far, But Terrorist Retaliation Cycle May Escalate
Iran launched a missile attack targeting around the Israeli nuclear research center late on March 21, causing at least 7 people to be seriously injured and 64 hospitalized. Israel's missile defense system was unable to fully intercept the missiles, worsening the tense situation. This attack is seen as retaliation for Israel's bombing of Iranian nuclear facilities, and geopolitical tensions continue to rise. The United Nations has stated that there are currently no radiation anomalies, but the risk still exists.
動區BlockTempo2h ago
Trump Issues Ultimatum: Iran Must Open Strait of Hormuz Within 48 Hours "Or We'll Bomb Power Plants," Bitcoin Plummets to 68,000
Trump issued a 48-hour ultimatum this morning (22nd) demanding Iran fully open the Strait of Hormuz, otherwise the U.S. military will destroy Iran's power plants; following the announcement, Bitcoin plummeted rapidly to $68,000, with the Fear and Greed Index dropping to 9, indicating extreme market panic.
(Background: Iran launched medium-range missiles at U.S. and British bases, missing but with a range of 4,000 kilometers, "double what intelligence estimated")
(Context: Lai Ching-te approved: Nuclear Plants 2 and 3 "have conditions for restart," Taiwan's power shortage in the AI era cannot be sustained)
Contents of this article
Toggle
Middle East conflict has been burning for over 4 weeks
Bitcoin crashes to $68,000, liquidations of $236 million
48-hour countdown, market awaits three answers
U.S. President Trump posted on his social media platform Truth Social at 7:44 AM this morning (22nd)
動區BlockTempo3h ago
