Bitcoin's bottom still not found! VRP indicator plunges 45%, experts warn that a second wave of decline is imminent
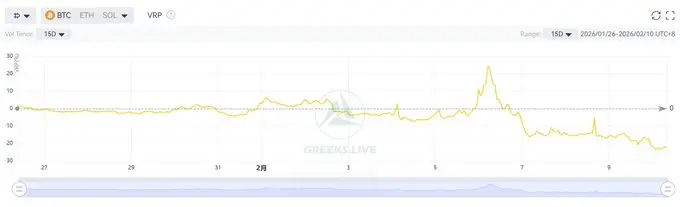
According to GreekLive analysis, the recent market has stabilized somewhat, but implied volatility (IV) has dropped significantly, causing the one-week volatility risk premium (VRP) to plummet from +20% last week to -25%, a decrease of approximately 45%, setting a new record. This indicates that the market is rapidly adjusting its expectations for future volatility downward. However, Bitcoin’s volatility tends to be highly clustered, and institutional sentiment may be overly optimistic. The irrationality in the options market is increasing, and historical experience suggests that Bitcoin’s bottom has not yet been confirmed.
VRP Plunges 45%: A Dangerous Signal of Institutional Optimism
(Source: GreekLive)
Based on the latest data from GreekLive, the market has recently stabilized, with implied volatility (IV) for major maturities showing a clear decline. However, the actual realized volatility (RV) over the past week remains high, creating a divergence that has led to a historic average one-week VRP drop of 45%. Specifically, the VRP has sharply fallen from last week’s +20% to the current -25%, a phenomenon extremely rare in Bitcoin’s history.
The VRP (Volatility Risk Premium) is a key indicator measuring the difference between market-expected volatility and actual realized volatility. A positive VRP indicates that the market expects future volatility to be higher than past realized volatility, often reflecting cautious sentiment. Conversely, a negative VRP suggests the market believes future volatility will be calmer, which is often associated with excessive optimism. The rapid drop from +20% to -25% within a short period signifies that market sentiment has shifted swiftly from cautious to overly optimistic.
This phenomenon’s danger lies in Bitcoin’s volatility’s strong clustering characteristic. Volatility clustering means high-volatility periods tend to occur consecutively rather than as isolated events. Over the past week, Bitcoin has fallen over 45% from its all-time high, with actual volatility soaring to very high levels. Yet, the market has quickly lowered its expectations for future volatility, indicating that institutions may be overly optimistic about the trend.
GreekLive explicitly warns that such reckless attitude, if faced with a second wave of decline, would leave institutions in a very passive position. The irrationality in the options market is clearly rising, and institutions are being caught off guard by recent price movements. Historically, such situations often indicate that Bitcoin’s bottom has not yet arrived but that further volatility testing is imminent.
Three Major Warnings from the VRP Crash
Institutional Position Risk: Excessive optimism may cause institutions to maintain overly high risk exposure, forcing forced liquidation during a second downturn.
Options Pricing Imbalance: Underestimating volatility expectations leads to undervaluation of put options, leaving the market unprepared for downside risks.
Historical Pattern Confirmation: Similar rapid turns of VRP negative occurred before phase bottoms in both the 2022 and 2018 bear markets.
From a trading strategy perspective, the current VRP structure offers contrarian investors an opportunity to buy volatility. If Bitcoin indeed experiences a second decline, actual volatility will surge again, and the currently underestimated implied volatility will quickly adjust upward, allowing volatility buyers to realize significant gains.
Whale Contrarian Accumulation: 66,940 BTC Flow into Accumulation Addresses
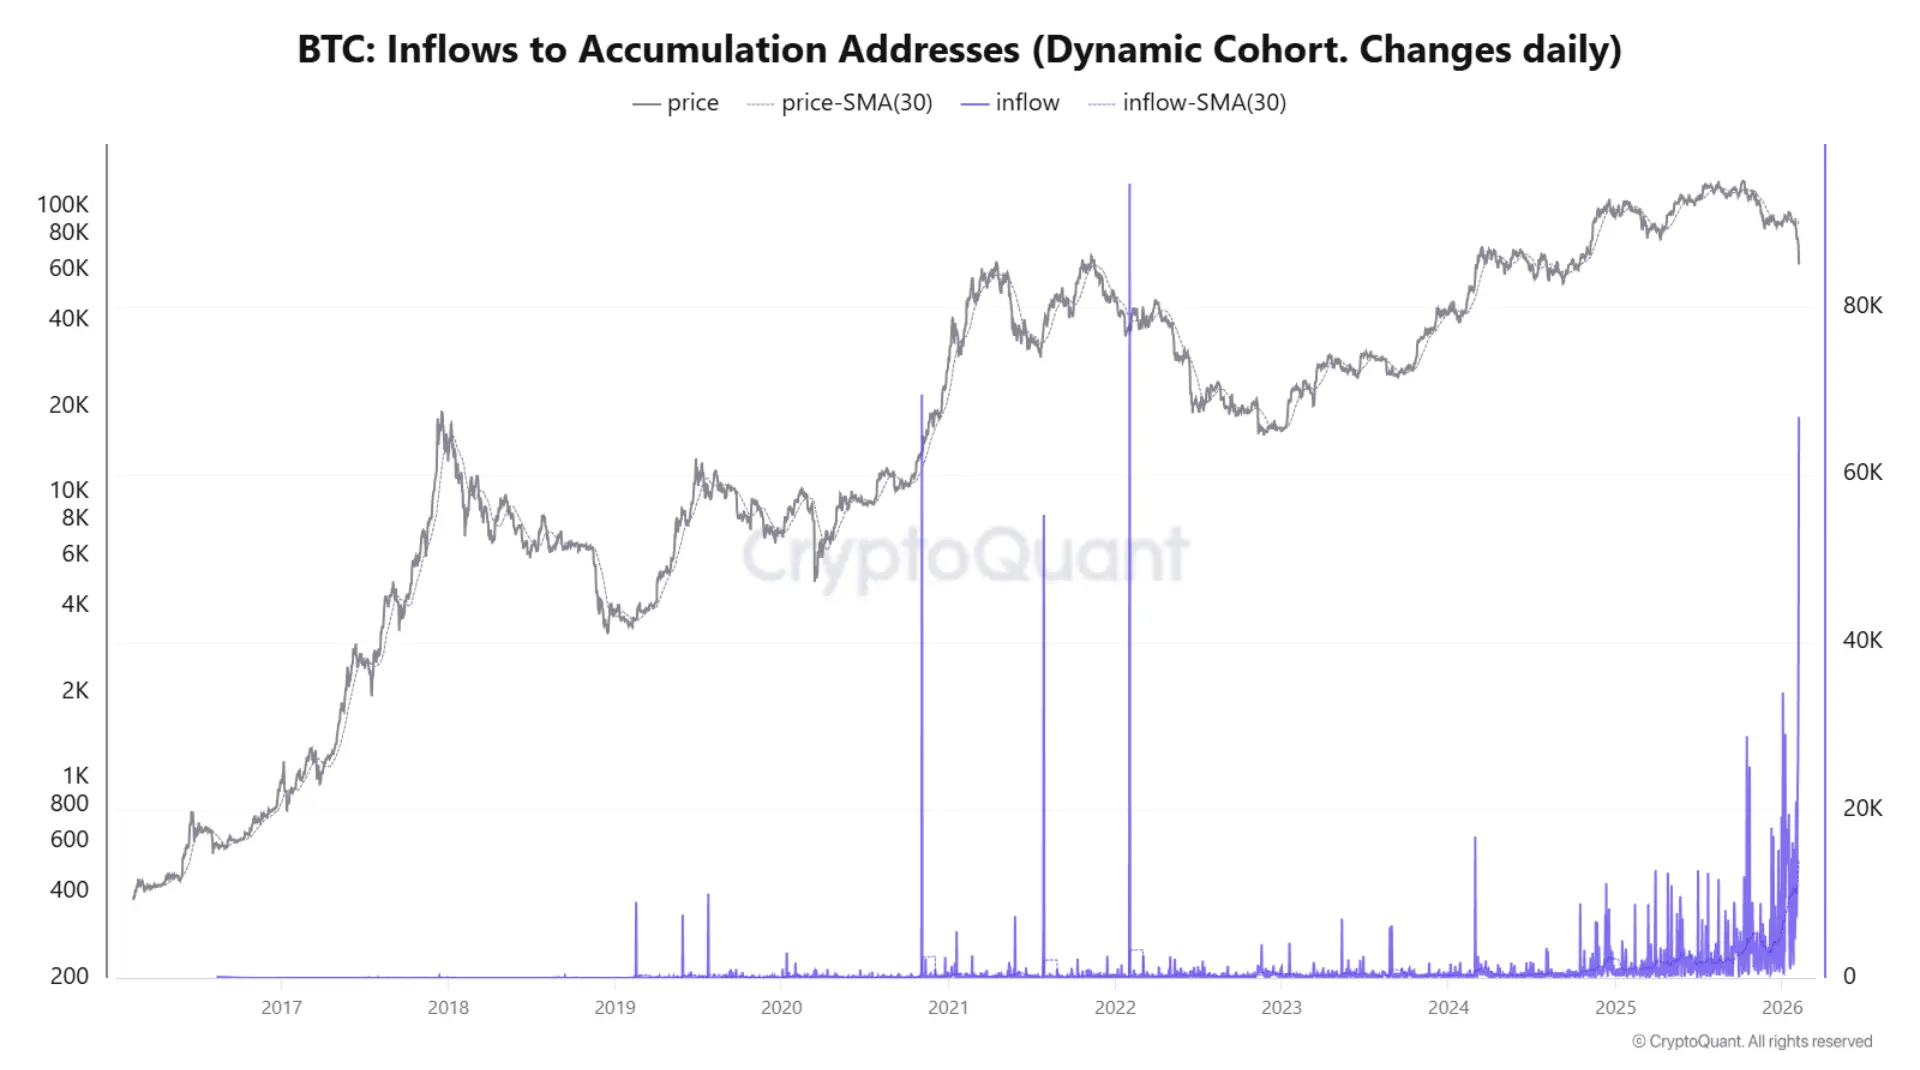
Despite GreekLive’s warnings, on-chain data shows that large holders are actively accumulating during the dip. According to CryptoQuant data, approximately 66,940 Bitcoin flowed into accumulation addresses on February 6, representing the largest single-day inflow in this cycle. This suggests that major holders are absorbing supply during the decline and holding these tokens rather than selling on exchanges.
Accumulation addresses refer to wallets that are held long-term and are not actively spent; these are typically seen as steadfast long-term investors or institutions. The 66,940 BTC, at current prices around $70,000, amounts to roughly $4.68 billion in inflows. Such a large inflow in a single day is rare in Bitcoin’s history, indicating that some large participants see current prices as attractive.
In other words, traders are transferring Bitcoin into wallets that historically distribute more slowly. This is significant because panic selling usually only persists after buyers have exited. Here, the opposite is happening: the deeper the decline, the more coins flow into wallets that tend not to sell in the short term, tightening liquidity and potentially stabilizing prices.
Further confirmation comes from Glassnode data, which shows that the supply held by wallets with 1,000 to 10,000 BTC has increased noticeably during recent sell-offs, implying that whales are increasing holdings as prices weaken. These holders often absorb supply during deleveraging phases, helping to end the sell-off more quickly.
However, caution is advised when interpreting single data points. Peak inflows in a single day may be noisy, caused by internal reorganization, exchange cold/hot wallet transfers, or technical factors. The real confirmation of whale bottom-fishing will come from sustained inflows over multiple days. If the next week’s cumulative inflow remains high, it will strongly support the argument that “the crash will not last.”
Sharpe Ratio Drops to -10: A Historic Bottom Signal
(Source: CryptoQuant)
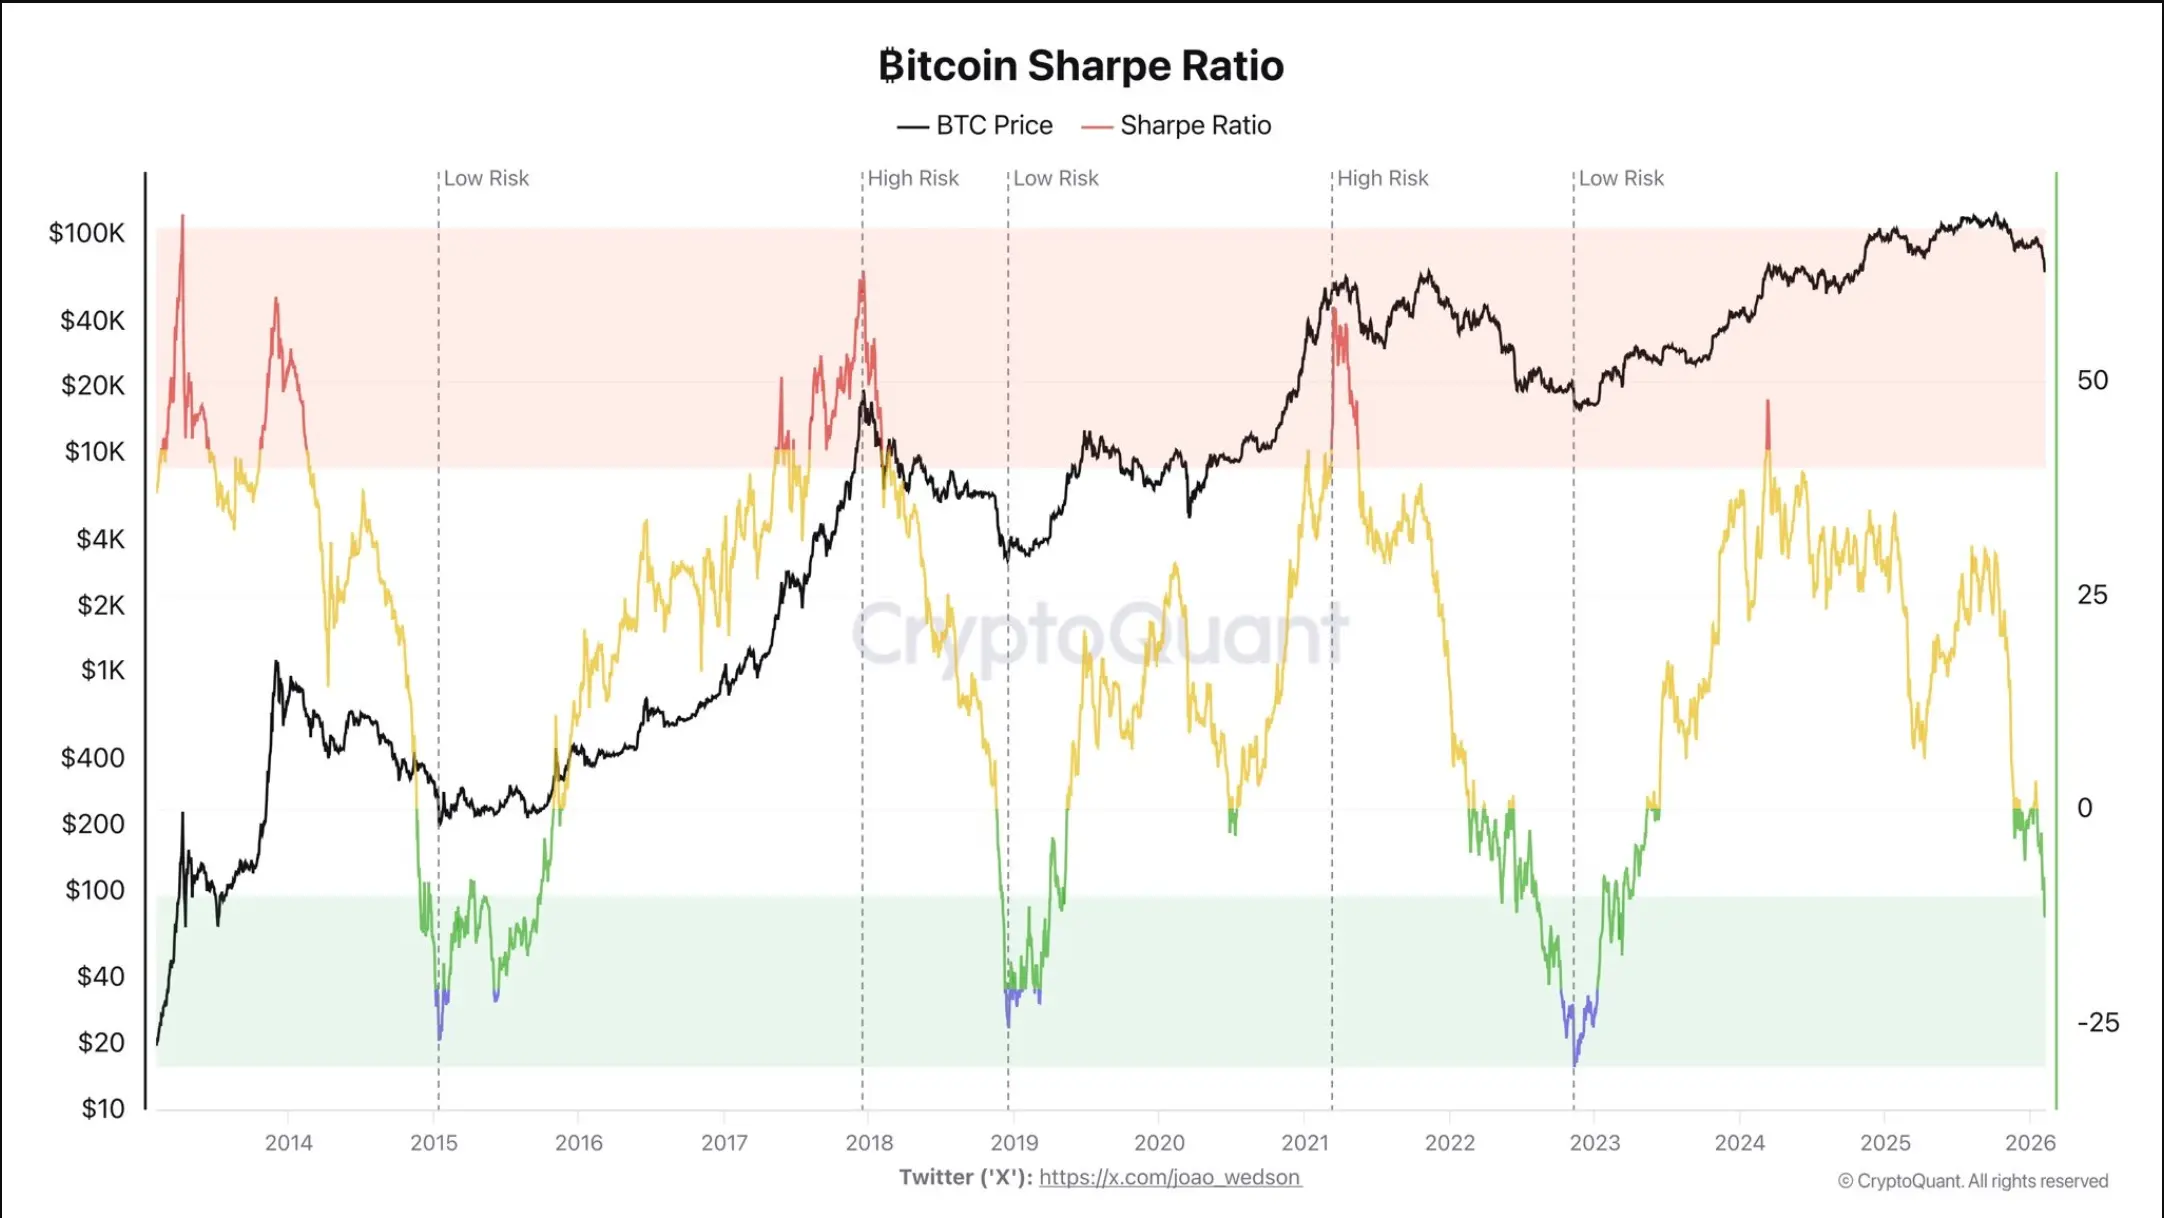
CryptoQuant analyst Darkfost states that Bitcoin’s Sharpe ratio has fallen to about -10, the lowest since March 2023, placing it in a region consistent with late-stage bear markets historically. The Sharpe ratio measures risk-adjusted returns; a negative value indicates recent performance is unattractive relative to risk, which explains the ongoing downward pressure.
The Sharpe ratio is calculated as (asset return – risk-free rate) divided by the standard deviation of returns. Negative values mean the asset’s return is even below the risk-free rate, combined with high volatility. A reading of -10 is extremely negative, reflecting that investors are taking on significant risk but suffering substantial losses.
Key historical analogs show that similar negative readings at the end of 2018 and early 2019, and late 2022 to early 2023, coincided with market bottoms rather than signaling further declines. In December 2018, Bitcoin fell to around $3,200, with the Sharpe ratio also dropping below -10, followed by a months-long bottoming process. After the FTX collapse in November 2022, the Sharpe ratio again hit bottom, marking the final phase of the bear market rather than a deeper decline.
In practical terms, BTC may still carry short-term risks, but the risk-reward ratio is becoming increasingly asymmetric. When the Sharpe ratio hits extreme negative levels, further downside is limited, while potential rebounds could be highly rewarding. This often signals a trend reversal rather than continued deep declines.
However, the reversal of the Sharpe ratio does not happen overnight. Historical experience shows that recovering from extreme negative levels to positive territory can take weeks or months. Investors should not interpret the -10 reading as an immediate buy signal but as the start of a more favorable risk-reward profile.
Coinbase Premium Index Rebounds: US Institutional Demand Reawakening
(Source: CryptoQuant)
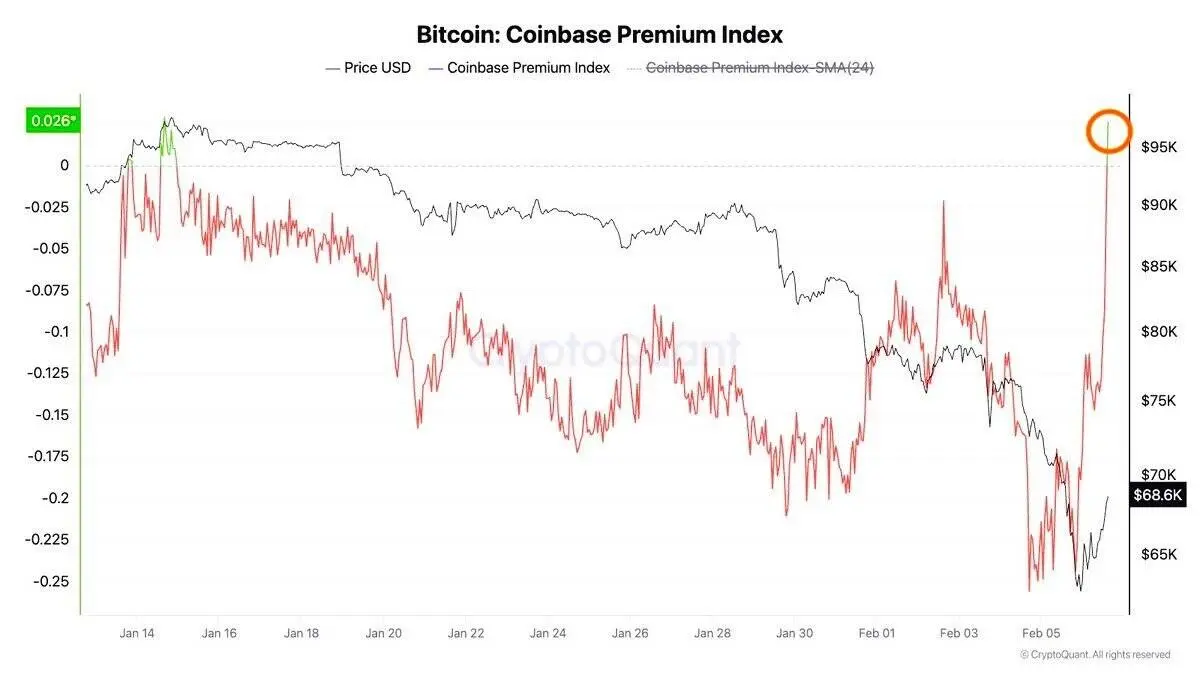
The Coinbase Premium Index, a key indicator of US institutional demand, has quickly rebounded into positive territory after Bitcoin’s price plunged into the mid-$60,000s. During most of January, Coinbase’s price was deeply discounted, indicating persistent selling pressure from US traders. The sudden reversal in February suggests that as prices weakened, spot buying on Coinbase increased.
The Coinbase Premium is calculated by comparing Bitcoin prices on Coinbase with those on other major exchanges like Binance. A positive premium indicates Coinbase’s price is above the global average, reflecting strong demand from US markets. A negative premium indicates selling pressure. Historically, during market declines, sharp rebounds in the premium often coincide with stabilization in local prices, as US institutions and high-net-worth buyers step in to absorb supply.
This further confirms that Bitcoin’s recent decline was supported by genuine spot demand rather than just technical rebounds or short covering. If the premium remains positive, it indicates ongoing accumulation rather than a temporary bounce followed by another decline. US institutions, through regulated channels like spot Bitcoin ETFs and Coinbase, are providing structural support to the market.
However, the rebound in Coinbase’s premium contrasts with GreekLive’s volatility warnings. On-chain data and spot demand show increasing buying interest, but derivatives market pricing suggests that institutions may be overly optimistic about future volatility. This divergence could reflect different behaviors among market participants: long-term investors bottom-fishing in spot markets, while short-term traders and options market makers underestimate upcoming volatility risks.
In summary, the market shows signs of both strong institutional demand and rising irrationality, which could set the stage for a volatile upcoming period. Investors should remain cautious and monitor these indicators closely.
Related Articles
Bitcoin is undervalued by approximately 66% relative to gold, and the Z-score signal indicates a potential major surge.
Gate Daily (March 2): Trump campaign faces "insider trading" allegations over Iran airstrike; Vitalik explains Ethereum execution layer roadmap
Quiet Timeline, Big Setup? 5 Crypto Trades to Watch as Market Cap Signals Rally
10xResearch: Market positions have been cleared, but liquidity remains relatively weak
Why did Bitcoin rise today? Showing resilience amid the Iran crisis, targeting $74,000.
Arthur Hayes says that if the U.S. intervenes in the Iran conflict for the long term, it could drive up Bitcoin prices