Ethena (ENA): Impressive recovery, but is the upward momentum sustainable?
Ethena (ENA) recorded an 11.55% increase in open interest (OI) over the past 24 hours, as the price surged by an impressive 5.08%. The rise in speculative demand occurred as ENA recovered from a local support level at $0.094.
According to the latest report from Coinphoton, the market has seen a significant increase in large buy orders from whale investors in the spot market. These large buy orders, often seen during sharp price declines, are considered signals that smart money is entering, helping to slow down the downward trend.
However, this signal alone does not confirm that the market bottom has been reached. Analyzing price charts on higher timeframes suggests that ENA’s upward momentum may be only temporary.
Bullish Divergence and Healthy Correction of ENA
No market moves in a single direction for long, and ENA’s behavior is no exception. Throughout 2026, ENA maintained a downtrend with only occasional upward corrections to reduce continuous selling pressure.
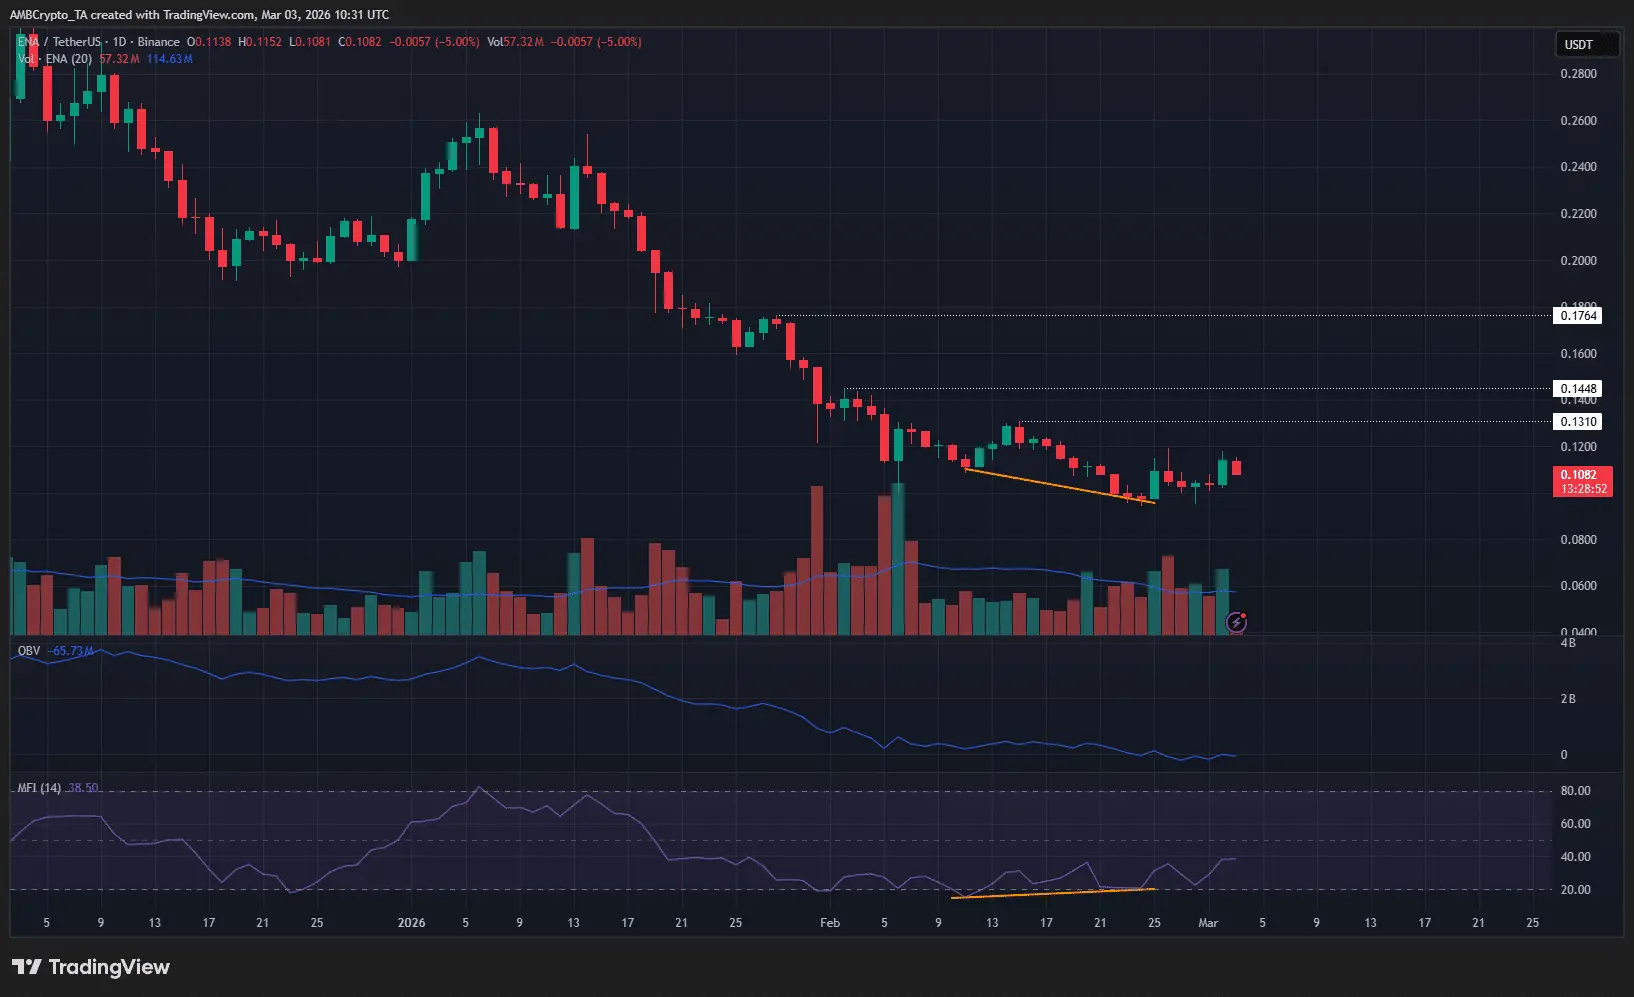 Source: TradingView However, in February, ENA’s decline began to slow. Notably, a bullish divergence signal appeared on the daily chart, with the RSI forming higher lows while the price made lower lows. This indicates that the rebound from the $0.095-$0.097 zone is likely a technical correction, temporary in nature.
The increase in trading volume, along with the rapid price rise, could be part of a natural adjustment process. Therefore, traders should exercise caution; instead of rushing to buy now, they should consider taking profits as the price recovers.
Short-term Outlook for ENA
A recent two-week liquidation heatmap analysis shows that the $0.120-$0.125 zone is a notable liquidity area, likely to attract ENA’s price in the short term. This suggests that ENA’s price could continue rising to test this liquidity cluster.
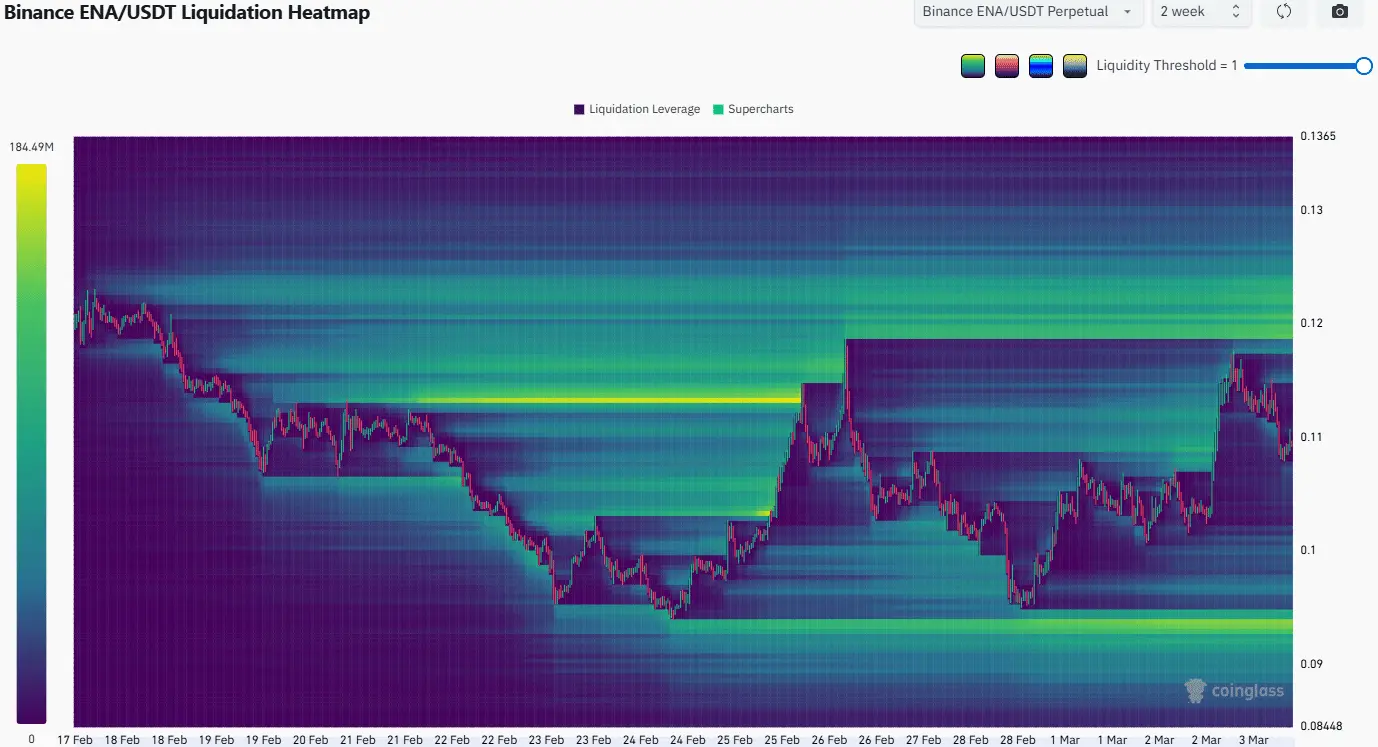 Source: CoinGlass However, it is important to note that this zone coincides with the 78.6% Fibonacci retracement level on the 4-hour chart. Although the OBV indicator is approaching local highs, this alone is not strong enough evidence to confirm an imminent trend reversal.
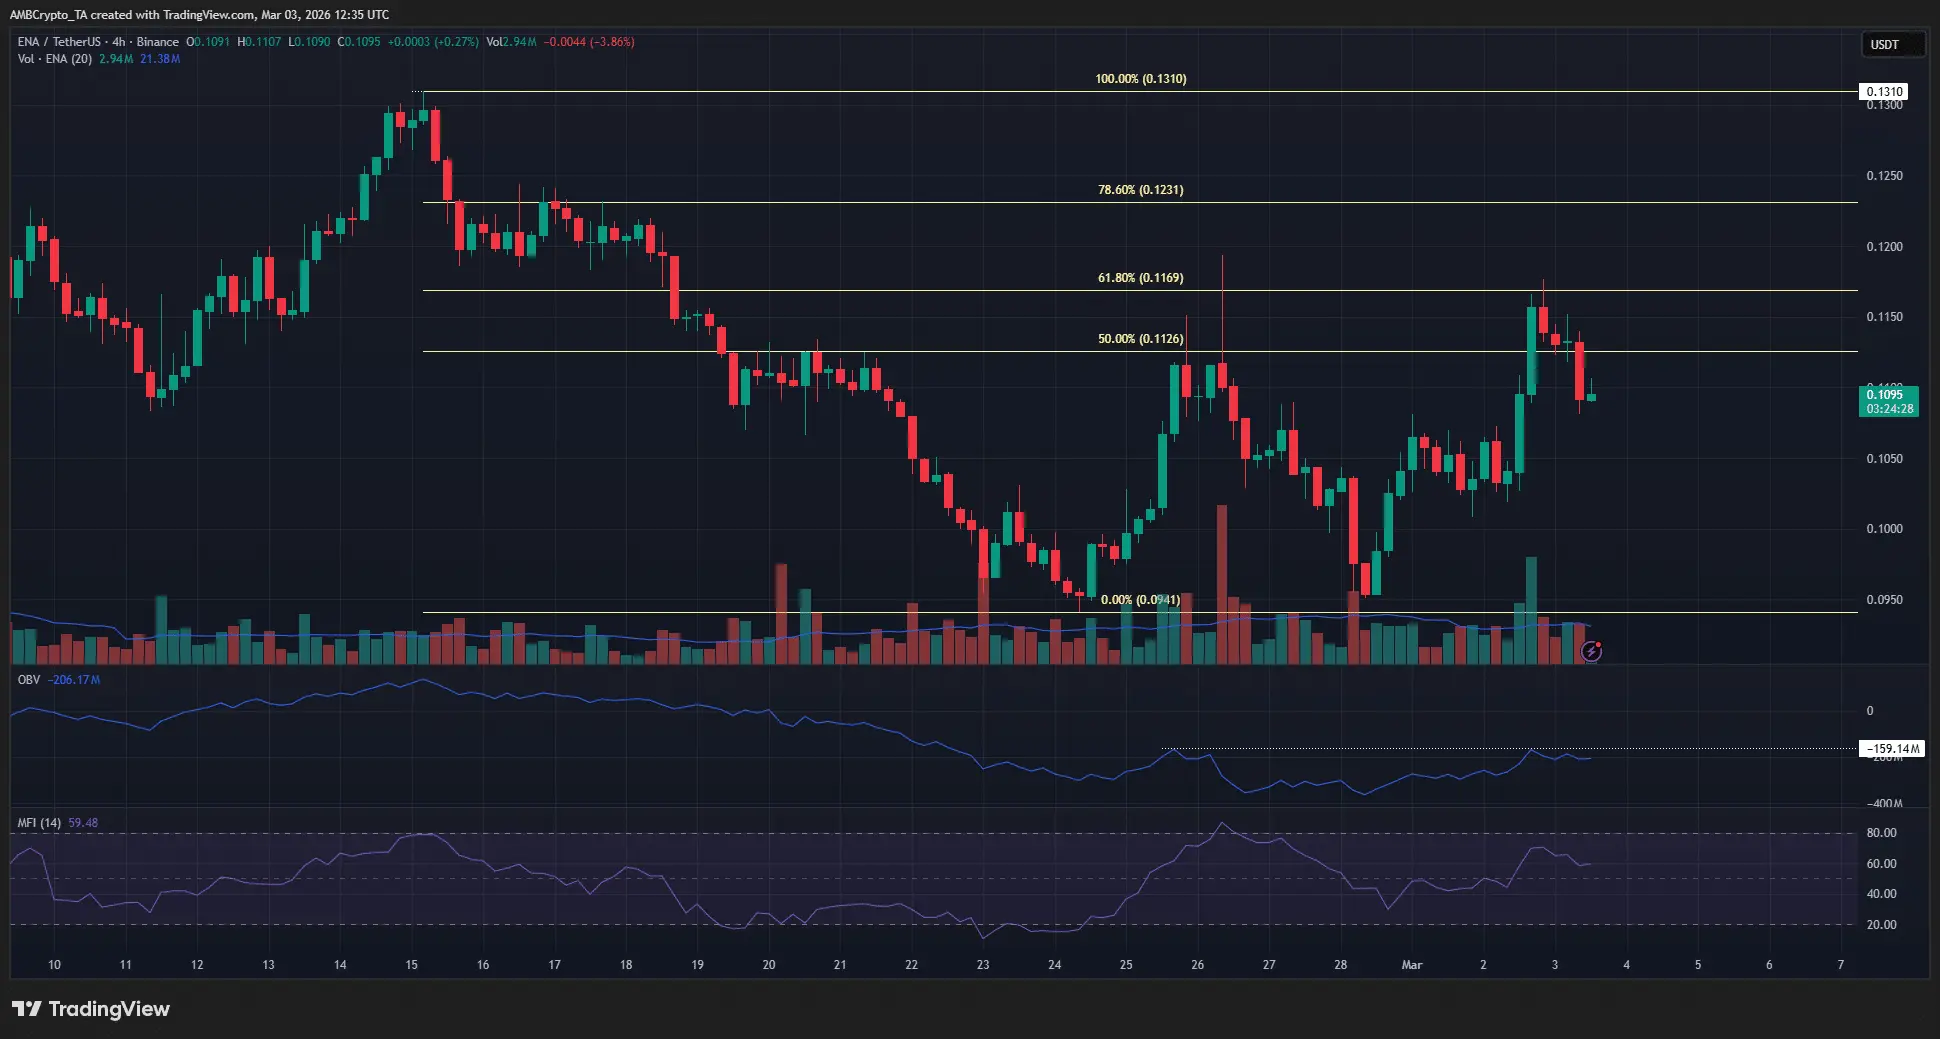 Source: TradingView Considering the broader market structure, the $0.131 level must be broken before buyers can expect a genuine trend reversal. Until then, current signals suggest any upward movement may be short-lived.
Related Articles
K33: Bitcoin enters an extreme weekly oversold zone, with selling pressure easing and a potential for a temporary rebound brewing
XRP Wedge Play: Dip to $1.20, Then 25% Pump to $1.50?
Analysis: The CLARITY Act's expected warming effect combined with the fiat devaluation logic regression is driving BTC to strengthen against the trend
Analyst: This round of Bitcoin price increase is driven by position resets and reduced supply elasticity
Analysis: Bitcoin bullish sentiment heats up, with $80,000 potentially becoming the next target for this rebound.